Summary
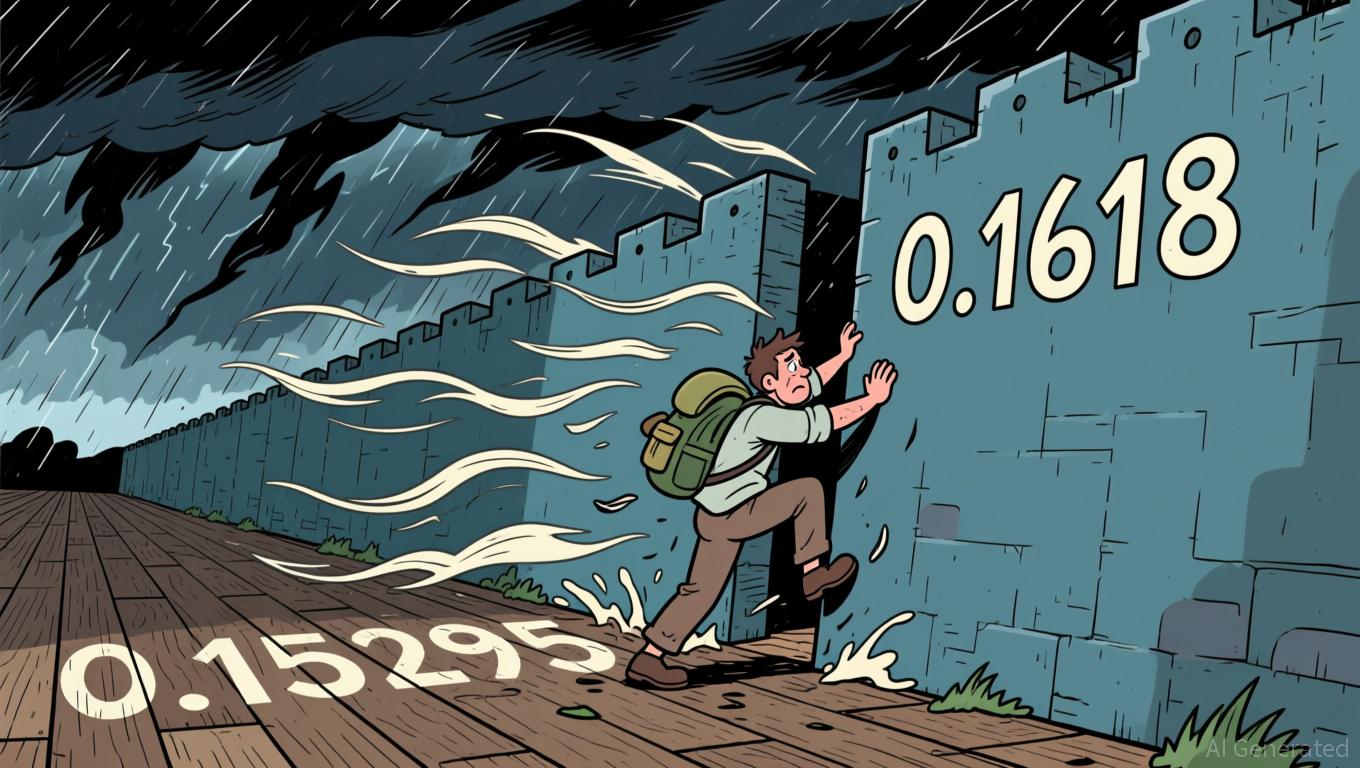
- BERAUSDT trades near key support at 0.15295 following a bearish engulfing rejection at 0.1580.
- 24-hour volume significantly exceeds 7-day averages, indicating elevated participation during the recent pullback.
- Price action shows range-bound structure with repeated wick rejections at 0.1618 resistance.
- Market appears to be in a consolidation phase after recent moderate gains over the past week.
- Immediate downside risk exists if 0.15295 support fails, while upside requires reclaiming 0.1580.
Range Contraction
Berachain/Tether (BERAUSDT) closed the latest hour at 0.1563 with a 24-hour total volume of approximately 144,853 USDT. The asset has exhibited tight price action around the 0.1500 to 0.1620 range.
1-Hour Support/Resistance and Candlestick Patterns
Price action over the last 24 hours highlights a clear resistance zone around 0.1580 to 0.1618, where the asset faced multiple rejections. The high of 0.1618 recorded on August 3rd at 17:00 UTC served as a significant ceiling, followed by a lower high at 0.1598 on August 4th at 02:00 UTC. These rejections confirm the presence of selling pressure at these levels. On the support side, the low of 0.1488 on August 3rd at 04:00 UTC and the subsequent low of 0.1549 on August 4th at 02:00 UTC establish a dynamic support floor. The current price of 0.1563 is closer to the immediate support level of 0.15295 than to the resistance at 0.1580. Candlestick patterns provide further insight into this structure. A bearish engulfing pattern formed at 02:00 UTC on August 4th, where the closing price of 0.1549 was significantly lower than the opening price of 0.1566, covering the prior candle's body. This pattern suggests a shift in short-term momentum toward the downside. Additionally, long upper wicks observed at 07:00 UTC and 18:00 UTC on August 3rd indicate repeated attempts by buyers to push prices higher were rejected, reinforcing the resistance narrative.
Volume and Turnover vs. Historical Comparison
The 24-hour total volume of approximately 144,853 USDT stands in contrast to the 7-day average daily volume of 104,800 USDT and the 15-day average daily volume of 208,336 USDT. This indicates that while current volume is elevated compared to the recent week, it remains below the broader two-week average. When examining hourly data, the volume spike at 02:00 UTC on August 4th, with 24,564 USDT, is notable. Given that the 7-day average single-hour volume is approximately 4,366 USDT, this spike exceeds the thresholdT-- of 2x the average by more than five times. Following this high-volume event, the price moved from an open of 0.1566 to a close of 0.1549, representing a decline. This suggests that the volume spike was associated with selling pressure rather than a bullish breakout. Other significant volume hours include 08:00 UTC on August 3rd (15,495 USDT) and 10:00 UTC on August 3rd (11,276 USDT), both of which occurred during periods of upward price movement, indicating some buying interest. However, the most recent high-volume candle resulted in a price drop, implying that volume anomalies have not effectively driven sustained upward momentum in the immediate term. The lack of follow-through after the 02:00 UTC spike suggests that buyers may be exhausted at these levels.
Look Back: Current Market Phase
Analyzing the 7-day and 15-day price structures reveals a market that is currently in a sideways or range-bound phase. The 15-day daily price range is reported as 5%, which falls well within the 10% threshold for a sideways market. Over the past 7 days, the price has appreciated by approximately 2.96%, and over the past 3 days by 2.16%, indicating a mild upward bias within the broader consolidation. However, the repeated rejections at resistance levels and the failure to sustain breaks above 0.1618 suggest that the market is not in a strong uptrend. The structure is characterized by lower highs being formed relative to the recent peak, and the current price action is contained within the established support and resistance bands. This behavior is consistent with a consolidation phase where the market is absorbing recent gains and preparing for the next directional move. There is no evidence of a strong downtrend with lower lows, nor is there a clear uptrend with higher highs. The market appears to be in a mean-reverting state within a defined range, with volatility constrained by the key levels identified.
The next 24 hours will likely see continued consolidation unless a decisive break occurs. A break below 0.15295 could trigger further downside towards 0.1500, while a sustained move above 0.1580 may signal a resumption of the mild uptrend towards 0.1618. Traders should monitor volume confirmation for any potential breakout or breakdown.