
Mubarak/USDC Rejects Breakout at Resistance
 Aime Summary
Summary
- Mubarak/USDC rallied 6% over three days before rejecting at 0.03356 resistance.
- Volume spiked significantly during the 07:00 UTC breakout, driving immediate price action.
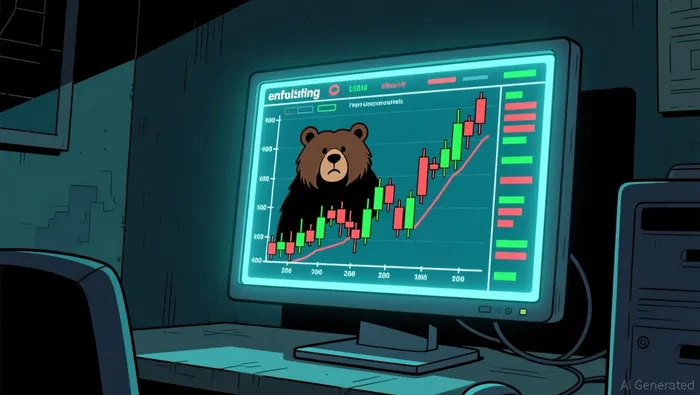
- Bearish engulfing pattern at 12:00 UTC suggests short-term seller dominance.
- Price remains range-bound, currently closer to immediate support than resistance.
- Caution advised as upside rejection signals potential mean reversion toward 0.0300.
Sharp Rejection After Breakout
Mubarak/USDC (MUBARAKUSDC) closed the 12:00 UTC hour at 0.03085, down from a high of 0.03356, with a 24-hour total volume of approximately 3.2 million USDCUSDC--. The asset experienced a notable surge in turnover earlier in the session, reflecting active trading interest amidst recent volatility.
1-Hour Support/Resistance and Candlestick Patterns
Price action in the last 24 hours demonstrates a clear rejection at the 0.03356 level, where the high was established during the 07:00 UTC hour. This level acts as immediate resistance, having been tested and failed to hold above in subsequent hours. Support is visible at 0.03105, where price found a bid during the 02:00 UTC hour before the next leg up. The 12:00 UTC candle exhibits a bearish engulfing pattern, as the body fully covers the prior candle's range, indicating strong selling pressure. Additionally, the 07:00 UTC candle features a long upper shadow relative to its body, suggesting rejection at higher prices. Current price action sits closer to the 0.03105 support level than the 0.03356 resistance, suggesting a potential pullback or consolidation phase may be underway.
Volume and Turnover vs. Historical Comparison
The 24-hour total volume of roughly 3.2 million USDC significantly exceeds the 7-day average daily volume of 2.78 million USDC, indicating heightened activity. Specific hours showing volume anomalies include 22:00 UTC on September 11 with 756,128 USDC and 04:00 UTC on September 12 with 447,446 USDC, both surpassing the average single-hour volume of approximately 116,005 USDC by more than double. The 07:00 UTC hour recorded 468,018 USDC, also well above the 7-day average. Following the 22:00 UTC volume spike, price moved higher in the subsequent hours, suggesting effective buying pressure. However, the high volume at 07:00 UTC was followed by a price decline in the next 3-6 hours, indicating that the volume did not sustain the upward move. This suggests that while volume anomalies drove initial price action, selling pressure effectively absorbed the buying interest at higher levels.
Look Back: Current Market Phase
The 15-day daily price range is approximately 0.02, and the 7-day price change is about 1.25%, while the 3-day change is 6.09%. These metrics suggest the market is currently in a range-bound phase, characterized by consolidation after a short-term uptrend. The market structure feature confirms this range-bound state, with price oscillating between key support and resistance levels. The recent sharp rise followed by a rejection suggests a potential mean reversion scenario, where price could correct toward lower support levels after the rapid move. The absence of sustained higher highs or lower lows in the broader context supports the view that the asset is consolidating within a defined range rather than trending decisively in either direction.
In the next 24 hours, price could test support levels around 0.03105 if selling pressure persists. An upside break above 0.03356 resistance with sustained volume could signal a resumption of the uptrend, while a breakdown below 0.0300 support may indicate further downside risk.

Decoding market patterns and unlocking profitable trading strategies in the crypto space
Latest Articles
Stay ahead of the market.
Get curated U.S. market news, insights and key dates delivered to your inbox.


AInvest
PRO
AInvest
PRO




Comments
No comments yet