Westwood Holdings Group (NYSE: WHG) releases its second-quarter 2026 results after the close of trading on August 6 — today. The specific numbers aren't public yet. But the numbers that are public tell a more interesting story about what the market already believes will happen, and whether that belief is justified.
WHG trades at $19.48, up 13.2% year-to-date. Its trailing PE is 25.1 times. Its forward PE is 61.7 times. The gap between those two multiples is the headline. A forward PE of 61.7 implies the market expects earnings of about $0.32 per share next year, down nearly 60% from the trailing-run rate of $0.78 per share. That is a severe expectation of earnings compression priced into a stock that reported a 194% year-over-year jump in free cash flow.
The market is pricing a crisis that the cash-flow statement does not support. That is the starting point for the analysis.
Quick Backtesting Tool
What WestwoodWHG-- Actually Does
Westwood is a boutique asset and wealth management firm headquartered in Dallas. It manages approximately $18.3 billion in assets — a figure that rose from $16.8 billion a year earlier. Revenue comes from management fees on those assets and advisory fees. It also runs a small family of actively managed ETFs and invests in partner vehicles, including WEBs Investments, a firm it helped launch with an option to acquire subject to growth milestones.
The business is capital-light and fee-driven. There is no inventory, no manufacturing infrastructure, and negligible capital expenditure — $775,000 over the trailing twelve months. That capex figure is the first clue about why free cash flow tells a different story than reported earnings.
The Earnings Problem
Gross margins sit at 92.5%, which is what you'd expect from an asset management business where revenue is fee income. Operating margins are 3.6%. That wide gap between gross and operating profit means compensation, general overhead, and non-cash accounting charges consume the bulk of every revenue dollar.
That structure is the root of the valuation disconnect. In an asset management firm, GAAP earnings can swing violently with one-time items such as fair value adjustments on contingent consideration, timing of compensation payments, or the write-up and write-down of equity investments in partner ventures.
The forward PE of 61.7 reflects the market's fear that these volatility-driven earnings swings will persist or worsen. It is a reasonable fear in isolation. The question is whether it should drive the entire valuation.
The Cash-Flow Counterpoint
Free cash flow over the trailing twelve months is $20.5 million, up 194% year-over-year. The FCF margin is 21%. The enterprise value of $145.8 million buys that cash flow at just 7.1 times. An FCF yield of 14% on enterprise value is attractive even for a small-cap name — it is the kind of cash conversion you see in mature, capital-light businesses that have worked through a cash-flow inflection.
Capex of $775,000 per year is essentially a rounding error. The company is not spending its way to the future; it is collecting fees and returning cash. The gap between operating income and free cash flow — operating margins at 3.6% but FCF margins at 21% — suggests significant non-cash drag on GAAP earnings, likely from those fair value adjustments and the timing of compensation that the company itself flagged in prior quarters.
If earnings are noisy but cash flow is resilient, the forward PE loses its disciplinary force. You price the cash flow, not the accounting volatility.
The Balance Sheet Gate
The balance sheet carries no meaningful risk. Total debt is $24.3 million against $23.4 million in cash and cash equivalents, for net debt essentially at zero. The debt-to-equity ratio is 0%. The current ratio is 4.44 times. Stockholders' equity stands at $126 million, giving a book value per share of approximately $13.44. The stock trades at 1.47 times book.
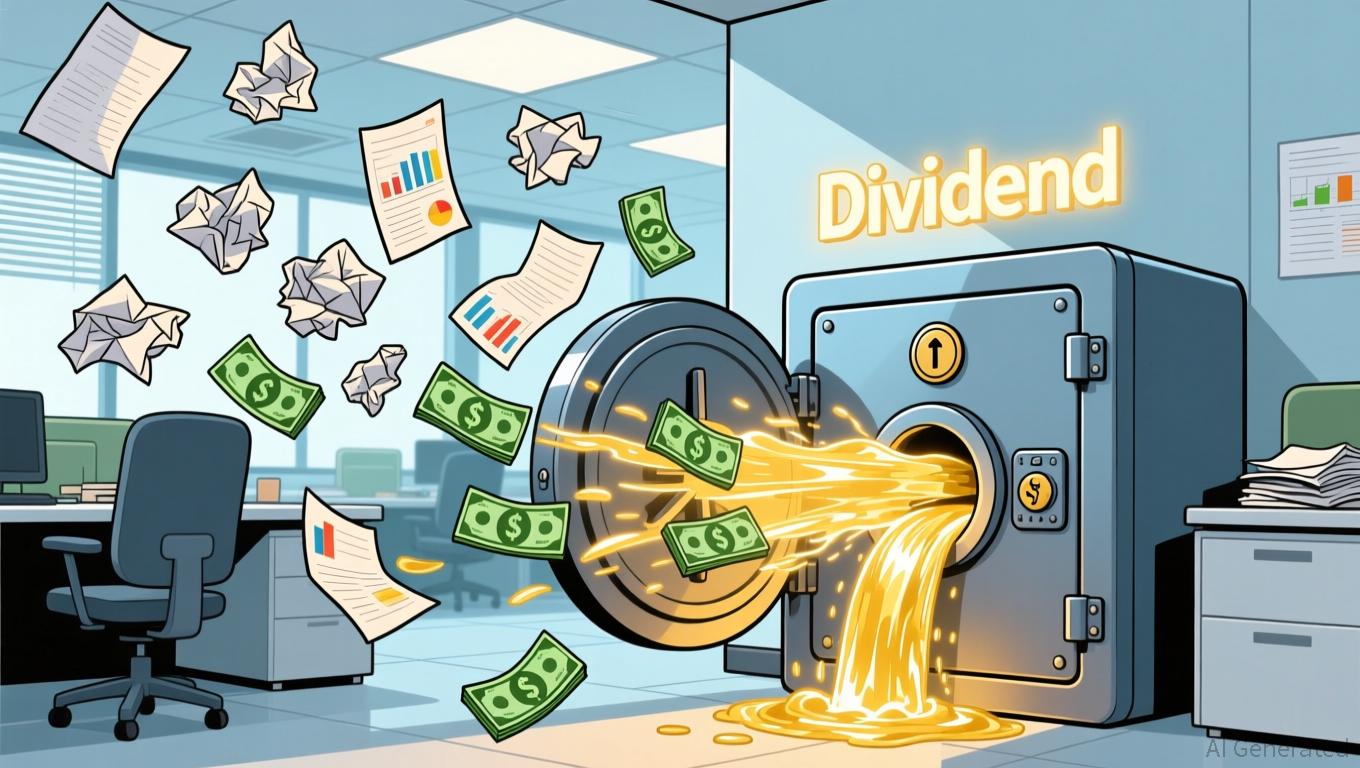
For an asset manager, a net-cash balance sheet is not unusual, but it is material to the dividend thesis. When earnings are volatile, the balance sheet is what stands between the company and a dividend cut. Here, there is no debt to service, and cash is already on the books.
Dividend Durability
Westwood has paid dividends for 23 consecutive years. The trailing-twelve-month payout ratio is 76.8%, which sounds high — until you check the free cash flow coverage. At $20.5 million in FCF, the company generates roughly 3.7 times the cash needed to fund its annual dividend. That is not a marginal coverage ratio. It is comfortable.
The forward dividend yield is 3.08%. On an EV basis, the yield is higher still because there is no debt to subtract. For a retirement income portfolio, the dividend is the anchor, and the anchor holds: FCF coverage is strong, the balance sheet is clean, and the 23-year track record suggests management treats the payout as a commitment rather than an option.
What Today's Results Change
Q1 2026 EPS came in at $0.31, no analyst estimates existed for comparison. The forward consensus of $0.32 for the coming year sits near Q1's $0.31, suggesting the market is anchoring to recent quarters rather than modeling a path.
What matters from today's report: AUM levels and revenue trend. AUM of $18.3 billion as of June 2025 is the last reported figure. Growth in AUM flows directly to fee revenue, which is the revenue that actually sustains the dividend. If AUM is stable or growing, the earnings noise becomes background static. If AUM is declining materially, the forward PE concern gains weight.
Beyond AUM, watch for commentary on the WEBs Investments partnership and its option-to-acquire milestones, the ETF suite performance (the Enhanced Midstream Energy ETF surpassed $100 million in assets), and any shifts in the compensation or fair-value accounting that has been the primary driver of GAAP earnings volatility.
The Valuation Gap
At 25.1 times trailing earnings and 1.47 times book, WHGWHG-- is not cheap. But it is not expensive either — it sits in the middle of the small-cap asset management range. The forward PE of 61.7 is the outlier, and it is driven by a consensus that may be over-reacting to earnings volatility rather than cash-flow deterioration.
The EV/FCF multiple of 7.1 times tells a different story. At that multiple, the market is paying roughly seven years of cash flow for a business with 23 years of dividend history, a net-cash balance sheet, and negligible capex requirements. If free cash flow holds near its current run rate, the implied annual return from yield alone — 14% on enterprise value — would compress the multiple rapidly. Even a moderate normalization of cash flow leaves room.
The valuation gap is not between current price and some aspirational target. It is between the forward earnings consensus and the cash-flow reality the balance sheet supports.
Investment Thesis
Westwood Holdings Group is a small-cap asset manager with clean balance sheet mechanics, strong free cash flow coverage of its dividend, and a valuation that reflects fear of earnings volatility rather than evidence of cash-flow weakness.
The forward PE of 61.7 assumes a 60% earnings decline that the 194% FCF growth does not corroborate. At 7.1 times EV/FCF and 3.7 times FCF-to-dividend coverage, the cash-flow story is the one that matters for a holding-period investment.
Rating: Buy. The position is a dividend-and-cash-flow play in the small-cap space, not an earnings-growth story. The gate that matters is AUM retention: if assets under management remain stable or grow through the back half of 2026, fee revenue will support current cash-flow levels and the forward earnings consensus will prove overly pessimistic. If AUM declines materially, the thesis narrows to the balance-sheet floor — which, at 1.47 times book and net cash, still provides a margin of safety.
The dividend is the reason to hold. The cash flow is the reason the dividend is safe. The forward PE is the reason the entry is not as expensive as it looks.