The narrative says stagflation is back. The data says something completely different.
The July ISM Manufacturing PMI hit 55.6 - the strongest factory-sector expansion since May 2022. The ISM Services PMI came in at 54.1, marking the 25th consecutive month in expansion. Manufacturing employment jumped to 52.8, back in growth territory for the first time in 33 months. Production accelerated to 58.5. These are not stagflation numbers. They are economic acceleration numbers.
Meanwhile, BitcoinBTC-- is trading at $64,680 - down 28.8% over the past 250 days, sitting just 12% above its 52-week low of $57,770, and roughly half its high of $125,500. EthereumETH-- is in even worse shape: $1,914, down 36% over the same period, less than half its 52-week peak of $4,949.
Quick Backtesting Tool
So here's the setup you actually have: a domestic economy that is expanding at its fastest clip in four years. Crypto markets trading at levels that signal deep distress. The Fear and Greed Index at 25 - a reading that sits in extreme fear territory. That is the exact kind of divergence where the contrarian signal gets interesting.
Because crypto is macro and macro is crypto. When the economy accelerates and sentiment is crushed, the liquidity cycle usually does its thing - even if the headline narrative has decided otherwise.
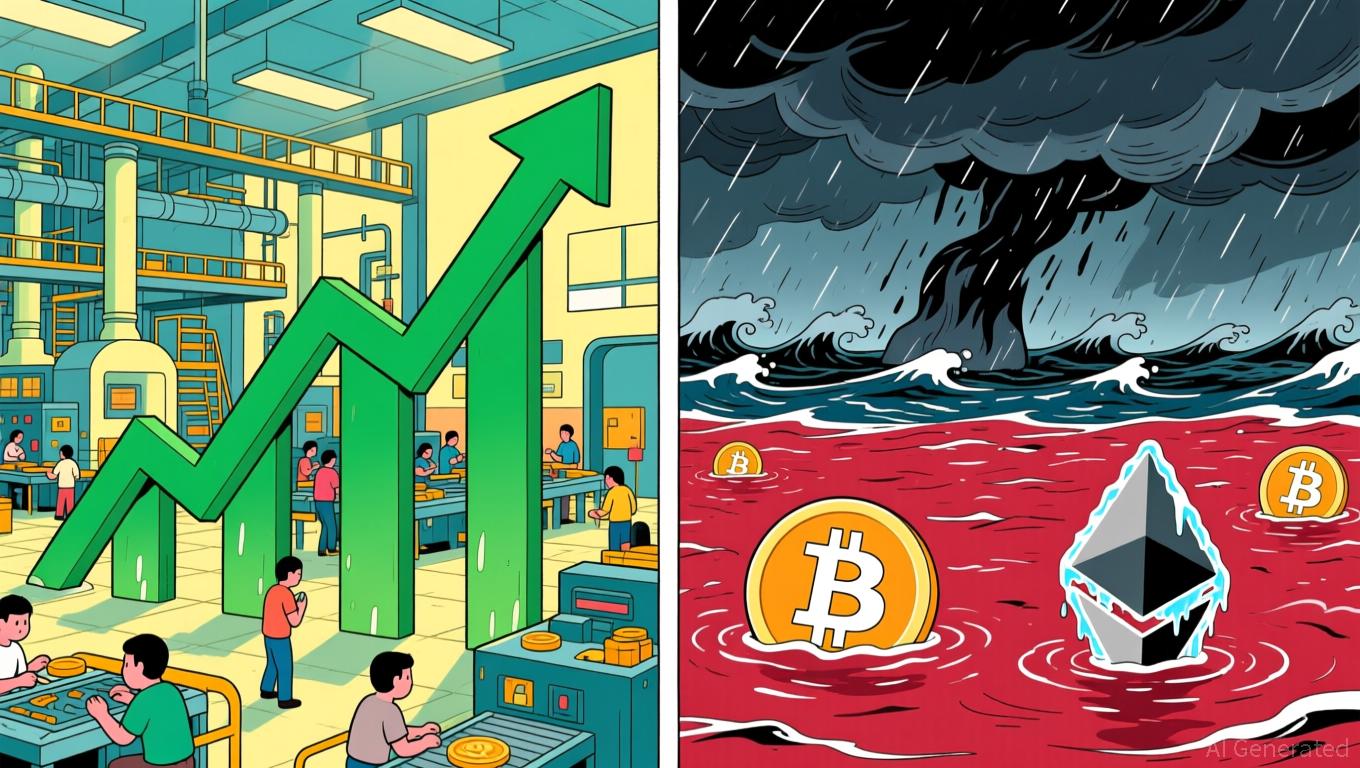
The PMI data that everyone is misreading
Let's go through what the ISM reports actually say, because the stagflation label does not survive contact with the data.
Manufacturing - The PMI printed at 55.6, well above the 50 threshold that separates expansion from contraction. New Orders came in at 56.7, and the Production Index hit 58.5, the highest since November 2021. Employment returned to expansion at 52.8 after 33 months in contraction. Customer inventories are at 40.7 - in "too low" territory, which typically means demand is outstripping supply and future production is set to grow further.
Services - The Services PMI registered 54.1, the 25th straight month of expansion. The Business Activity Index jumped to 59.1. New Orders came in at 57.2. The sector has been growing continuously for over two years.
Prices - This is where the stagflation crowd points. The manufacturing prices index came in at 71.1, and the services prices index at 70.3 - the latter having breached 70 for the fourth time in five months. Those are elevated input-cost readings. They have been above 60 for 20 straight months. But here's the thing: the manufacturing prices index has actually declined for three consecutive months, from 82.1 in May to 73.0 in June to 71.1 in July. The price pressures are moderating even if they're still high. That is the opposite of stagflation, where prices accelerate while activity stalls.
The economy is not stalled. It is expanding across both major sectors, employment is turning positive in manufacturing, output is accelerating, and price pressures are ticking down. Stagflation requires weak growth AND rising inflation. What we have is strong growth with sticky-but-cooling prices.
Where Bitcoin sits in this picture
Bitcoin at $64,680 is trading at levels that reflect something close to panic - despite an economy that is doing the exact thing risk assets need to rally.
The total crypto market cap sits at $2.2 trillion. Bitcoin dominance is at 58.87%, up from recent lows, which is flight-to-quality behavior. The Fear and Greed Index at 25 is in the same zone we saw when literally everyone was bearish in Q4 2022 - and that was the moment before the massive rally in crypto and tech.
The fund flow data on Binance tells an interesting micro-story. Net flows have been mostly negative this week: -$47M on August 2nd, -$66M on August 4th, -$27M on August 3rd. But today (August 6th), net flow turned slightly positive at $8.1M. It's a small signal, but the exhaustion of selling pressure is showing up in the data.
Here's the thing about Bitcoin that most people still don't internalize: it has always tracked the liquidity cycle. Fed Net Liquidity - the combination of the Fed balance sheet and reverse repo facility - is the leading indicator. The Fed balance sheet currently sits at $6.74 trillion, down from its peak of nearly $9 trillion but the pace of quantitative tightening has slowed. M2 money supply hit an all-time high of $23.16 trillion in June. That means there is a record amount of money in the system - it just hasn't been finding its way into crypto yet.
Why the divergence exists
The gap between macro conditions and crypto prices is not about the data. It's about narratives lagging the evidence.
Investors are pricing in the sticky prices index and the geopolitical backdrop - the Middle East conflict is still being cited in ISM comments (43% of negative comments in manufacturing mentioned the Iran war). Tariff uncertainty is hanging over the economy. These are real headwinds.
But the liquidity picture is more important than any of that. When you have an expanding economy, cooling price pressures, extreme fear in crypto markets, and record M2 - you have the conditions that historically precede liquidity-driven rallies. The question is not whether the economy can support higher risk asset prices. The question is whether sentiment will hold at 25 for long enough to keep prices depressed.
The answer, historically, is no. Fear that extreme does not persist. It mean-reverts. And when it does, the assets that were most punished - Bitcoin down 50% from its high, Ethereum down 61% - have the most room to snap back.
What to watch
ISM prices index - If this continues its three-month downtrend (82.1 → 73.0 → 71.1), the stagflation narrative collapses entirely and the path clears for a liquidity-driven rebound in risk assets. If it ticks back above 73, the price-pressure story gets more credible. Watch the August release.
Fed balance sheet and repo data - The Fed balance sheet at $6.74T and still declining is a drag, but the pace matters more than the direction. If QT (quantitative tightening) slows further or pauses, that is the liquidity trigger crypto has been waiting for. I could not get the exact current Fed net liquidity figure from available data today - it's a composite that requires combining the balance sheet with the reverse repo facility - but the direction of the balance sheet and the record M2 level give us the macro frame.
Fear and Greed at 25 - This reading has preceded reversals before. It is not a timing signal by itself, but combined with an expanding economy, it tilts the odds. When fear reaches this level and the economic data is strong, the contrarian edge is real.
CFTC positioning - I don't have the latest CFTC speculative positioning data for Bitcoin from this run, but if positioning is still net short (as it was at comparable fear levels historically), the squeeze potential is significant.
The GMI Big Picture
The stagflation narrative is built on the input-cost data that ISM publishes - and that data is elevated. But stagflation requires weak growth, and the growth data is the opposite of weak. Manufacturing at a four-year high. Services expanding for 25 months. Employment turning positive.
Bitcoin and Ethereum are priced as if the economy is breaking. It isn't. They are priced as if liquidity has dried up. M2 is at a record high. They are priced as if there is nothing left to rally. The Fear and Greed Index at 25 says investors have already priced in the worst.
That is not a recipe for further downside. That is the kind of divergence - strong economy, extreme fear, elevated liquidity - that the liquidity cycle has resolved higher before.
Good luck out there.