
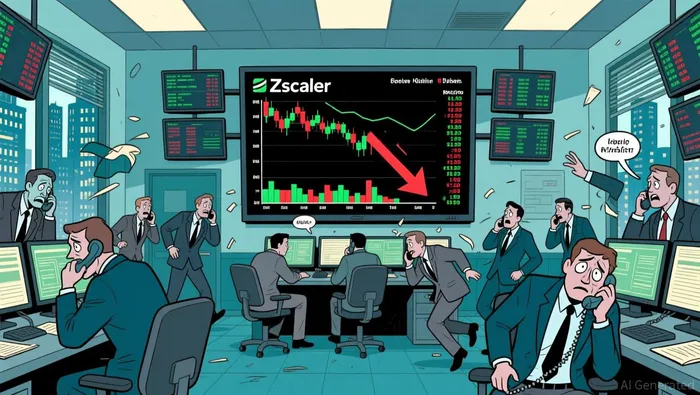
Zscaler Crumbles on Surging Volume—No News, Just Selling
Zscaler (: ZS) has triggered a significant technical breakdown, shedding 5.27% of its value to close near the session low at $115.79. This move is not a minor fluctuation; it is accompanied by a 2.6x spike in relative volume, signaling that the selling pressure is aggressive and likely institutional rather than passive drift. Why is ZSZS-- stock moving today? While no specific news catalyst has been identified in the last 24 hours, the price action itself tells a clear story of a failed consolidation and a resumption of the primary downtrend. The stock has breached the 20-day range low of $120.77, a level that previously acted as a floor, and is now trading at the 12th percentile of its recent range.
Why is the breakdown considered confirmed rather than a false signal?
The distinction between a temporary dip and a genuine trend resumption often comes down to volume and closing prices. In Zscaler's case, the evidence leans heavily toward a confirmed breakdown. The volume today was not just elevated; it reached the 96th percentile of the 60-day range, with a directional bar ratio of 0.77. This indicates that active sellers were in control throughout the session, pushing the price to close near the lows ($114.63) rather than allowing buyers to step in and recover losses.
Technically, the setup is bearish across multiple timeframes. The price is trading well below both the 20-day moving average ($143.89) and the 50-day moving average ($159.25), both of which are sloping downward. The gap between the current price and the 50-day average is widening, a classic sign of accelerating bearish momentum. Even though the 14-day Relative Strength Index (RSI) has dropped to 23.7, entering deep oversold territory, the slope of the momentum indicator suggests the selling pressure is still active rather than stalling. Historically, an RSI below 30 does not guarantee an immediate reversal; it often signals a continuation of a strong trend until price action confirms absorption of the selling pressure.
The market backdrop further isolates this move as idiosyncratic. While the broader Nasdaq was up slightly (+0.22%) and the S&P 500 was flat, Zscaler's 5.27% decline suggests a specific stock-level liquidation. The absence of a known catalyst, such as earnings guidance or regulatory news, points to a technical breakdown where the stock finally lost its structural support. When a stock breaks a key consolidation floor on massive volume without a specific fundamental reason, it often indicates that holders are exiting positions en masse, fearing further downside.
What is the most credible trade setup for the next 1-2 sessions?
The most credible scenario for ZscalerZS-- is a continuation of the downtrend with a test of lower psychological support levels. The primary thesis is based on the confirmation of the breakdown below $120.77. With the 20-day low breached and volume confirming the move, the path of least resistance is lower. Traders should watch for the stock to test the $110 level and potentially the $100 zone. The current price of $115.79 is only a short distance from the $110 psychological barrier, which often acts as a magnet in downtrends.
A practical trade structure would involve monitoring for a retest of the broken support level at $120.77, which could now act as resistance. If the stock attempts to rally back to this area on declining volume, it would likely fail, offering a high-probability short entry. However, if the stock continues to drop without a meaningful bounce, the momentum could accelerate toward $110. The key is to avoid assuming a bottom has formed simply because the RSI is oversold. The momentum is still accelerating downward, and the lack of buying absorption suggests the selling has not yet exhausted itself.
On the flip side, the bull case relies on a "dead cat bounce" or a capitulation bottom. If the massive volume spike today represents a final washout of weak hands, a sharp, short-lived rebound could occur. However, this would require a decisive close above $120.77 to invalidate the breakdown thesis. Until that level is reclaimed, the risk-reward ratio favors the bearish continuation scenario. The nearest support at $114.625 is fragile, and a break below it would likely trigger stop-losses, pushing the price toward $110.
What should investors and traders watch next to confirm or invalidate the thesis?
The next 1-2 sessions are critical for determining whether this is a true trend resumption or a false breakdown. The primary invalidation level is $120.77. A decisive daily close above this price would suggest the breakdown was a "shakeout" and the consolidation structure remains intact. If the stock can reclaim this level on high volume, the bearish thesis is broken, and the stock could quickly rally toward the $122.23 resistance zone.
Conversely, if the stock opens lower or fails to hold above $116.00, the bearish momentum is likely to continue. Investors should pay close attention to volume on any bounce attempts. A rally on shrinking volume would confirm that buyers are hesitant and that the selling pressure remains dominant. Additionally, the behavior of the RSI is a key monitoring metric; if the RSI remains below 30 for multiple sessions while price makes new lows, it confirms the strength of the downtrend.
There is also the factor of the unknown catalyst. Since no news has been identified, the market is pricing in a purely technical failure. If positive news emerges in the coming days, such as analyst upgrades or sector rotation into cybersecurity, it could rapidly reverse the technical setup. Until then, the focus remains on the price action at key levels. Traders should monitor the $110 support zone closely, as a break below it could signal the start of a steeper decline toward $100. At the end of the day, understanding ZS support and resistance levels is essential for navigating this volatility. The breakdown below $120.77 is the pivotal event, and the market's reaction to the $110 level will define the next phase of the trend.
Stay ahead of the market.
Get curated U.S. market news, insights and key dates delivered to your inbox.


AInvest
PRO
AInvest
PRO
Comments
No comments yet