
Yunji (YJ) Explodes 475% in Intraday Mayhem: A 7-Figure Turnover Ignites Volatility
 Aime Summary
Summary
• YunjiYJ-- (YJ) shares surge 475.62% to trade at $7.08, shattering previous resistance levels.
• Intraday volume hits 9.17 million shares with a staggering turnover rate of 361.25%.
• Price action ranges from a low of $1.33 to an all-time high of $8.25 during the session.
• The stock closes near the top of its range, signaling intense buying pressure despite bearish long-term technicals.
Massive Volume Surge Defies Technical Norms
The extraordinary 475.62% rally in Yunji is driven almost entirely by an explosion in liquidity rather than fundamental news or sector-wide momentum. With a turnover rate exceeding 361%, the market is witnessing a classic speculative breakout where capital flows rapidly into the ticker, pushing the price from a previous close of $1.23 to a peak of $8.25. This move is characterized by extreme volatility and high turnover, suggesting a short-term liquidity event or speculative accumulation that has temporarily decoupled the stock from its usual trading patterns. The absence of specific company news or sector catalysts indicates that the move is likely driven by algorithmic trading, short covering, or sudden retail interest, creating a vacuum where price discovery is purely momentum-driven.
The technical landscape presents a stark contradiction between short-term momentum and long-term structure. Key indicators reveal the following:
• 200-Day Moving Average: $1.56 (Price is significantly above, indicating a massive overextension)
• RSI: 30.76 (Currently in oversold territory on the daily chart, contradicting the intraday surge)
• Bollinger Bands: Upper at $1.53, Middle at $1.33, Lower at $1.13 (Price is vastly outside the upper band, signaling extreme deviation)
• MACD Histogram: -0.0001 (Near zero, indicating a potential loss of downward momentum but lack of strong bullish confirmation)
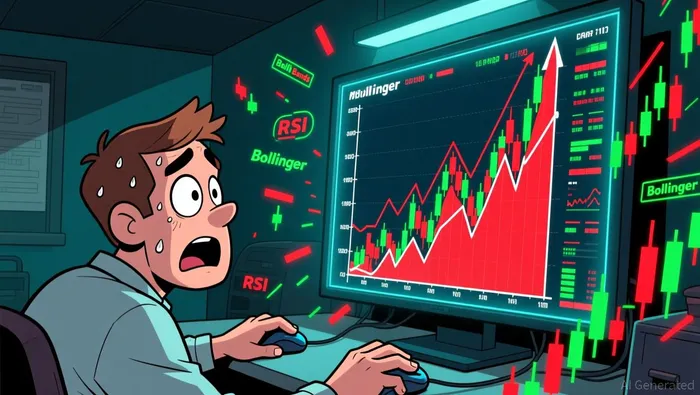
The technical setup is precarious. While the intraday move is bullish, the stock is trading far above its 30-day average ($1.37) and 100-day average ($1.60). The RSI of 30.76 on the daily chart suggests that prior to this surge, the stock was deeply oversold, and the current price action may be a violent mean-reversion attempt. However, the Bollinger Band expansion indicates that the price has moved three standard deviations away from the mean, a statistical anomaly that often precedes a sharp correction. Traders should exercise extreme caution; the gap between the current price of $7.08 and the 200-day moving average of $1.56 represents a massive premium that is unsustainable in the medium term without fundamental re-rating.

Regarding options, the provided chain is empty, offering no direct derivatives data for leverage or hedging. In the absence of option chain data, the focus must remain on the underlying asset's technical extremes. The high turnover of 9.17 million shares suggests that liquidity is sufficient for entry and exit, but the volatility risk is paramount. Without specific options contracts to analyze for gamma or theta efficiency, the strategy defaults to strict risk management. Aggressive traders might view any pullback toward the $1.44 support level (30-day resistance) as a potential mean-reversion play, while bulls chasing the $8.25 high risk significant downside if the speculative fervor fades. The lack of leveraged ETF data further isolates this trade to direct equity exposure, amplifying the need for tight stop-losses.
Given the empty options chain, no specific payoff calculations can be derived. However, the structural implication is clear: the stock is in a parabolic phase. If the price fails to hold above $7.00, a rapid reversion to the $1.50–$1.60 range is highly probable due to the extreme deviation from moving averages.
Exercise Extreme Caution Amidst Speculative Frenzy
The current move in Yunji is a testament to market liquidity and speculative energy rather than fundamental improvement. The 475.62% surge is unsustainable in the long term, as evidenced by the stock's position far above its 200-day moving average of $1.56 and the extreme deviation from Bollinger Bands. Investors should monitor the $1.44 support level closely; a break below this threshold could trigger a rapid mean-reversion to the $1.30s. In contrast, the broader Food Retail sector remains subdued, with leader Walmart (WMT) down 0.29%, highlighting that Yunji's move is idiosyncratic and not supported by sector tailwinds. Watch for a potential liquidity dry-up or profit-taking that could reverse the intraday gains swiftly, as the technical indicators suggest the stock is overextended and vulnerable to a sharp correction.

TickerSnipe provides professional intraday stock analysis using technical tools to help you understand market trends and seize short-term trading opportunities.
Latest Articles
Stay ahead of the market.
Get curated U.S. market news, insights and key dates delivered to your inbox.


AInvest
PRO
AInvest
PRO




Comments
No comments yet