
YFIUSDT Rallies to $2876 But Volume Divergence Raises Reversal Fears
Summary
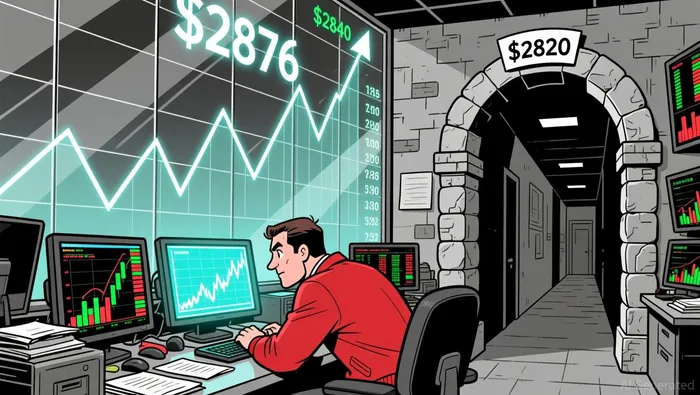
• YFIUSDTYFI-- formed key support at $2820 and tested resistance near $2860.
• Momentum accelerated mid-session before fading toward the close.
• Volatility expanded during a sharp rally to $2876, then contracted.
• Notional turnover surged during the $2876 high, then declined sharply.
• A bullish engulfing pattern emerged after a pullback from the $2876 peak.
Yearn.finance/Tether (YFIUSDT) opened at $2799, reached a high of $2876, and a low of $2776, closing at $2853 as of 12:00 ET. Total volume was 175.07 units, with turnover amounting to $49,848.59 over the 24-hour period. The pair traded in a defined range, showing both strong bullish and bearish impulses.
Structure & Candlestick Patterns
Price bounced off a key support level near $2820 and climbed into a resistance zone from $2850 to $2876. A bullish engulfing pattern emerged after a 5-minute bearish reversal near $2876, suggesting a potential short-term reversal. A doji formed near $2840, indicating indecision in that area.
Momentum and Volatility
The RSI climbed into overbought territory during the high near $2876 before retreating into neutral ground. MACD showed a bullish crossover during the rally but flattened as momentum faded. Bollinger Bands expanded during the sharp move up, with price briefly breaking the upper band before retreating inside the channel.
Volume and Turnover Divergence
Volume spiked sharply during the rally to $2876 and dropped significantly after the peak, indicating a potential exhaustion of buying pressure. Turnover spiked during the $2876 high but declined during the pullback, highlighting divergence that could signal a short-term reversal.
Fibonacci and Key Levels
Fibonacci retracement levels suggested potential support at 38.2% and 61.8% near $2820 and $2844, both of which were tested during the session. The price could retest $2820 as a key support level in the near term.
Outlook and Risk
The pair appears poised to consolidate around $2850 with potential for a test of $2820 support or a challenge of $2876 resistance. Traders should remain cautious of divergence in volume and RSI, which may foreshadow a reversal. A break below $2820 could trigger renewed selling pressure, while a retest of $2876 could offer an opportunity for longs.
Decoding market patterns and unlocking profitable trading strategies in the crypto space
Latest Articles
Stay ahead of the market.
Get curated U.S. market news, insights and key dates delivered to your inbox.


AInvest
PRO
AInvest
PRO
Comments
No comments yet