
YDES Gaps Up Without a Clear Catalyst — Will It Hold?
Why is YD BioYDES-- (YDES) stock dropping today?
YD Bio (NYSE: YDES) opened at $6.425, immediately above its previous close of $5.46, marking a 17.7% gap up. The stock has since traded in a narrow range, reaching a high of $6.425 and a low of $6.0 before settling at $6.215, up 13.8% on the session. Despite the aggressive opening, the move lacks a clear catalyst, and the volume remains below average, suggesting the move may be driven more by speculative or order flow factors than fundamental news.
The broader market has been in a strong upward swing, with the Dow, S&P 500, and Nasdaq all posting gains of more than 1.2% as of this writing. YDESYDES--, however, is outperforming the indices, indicating a more isolated or speculative push than a broad-based trend. The key question now is whether this gap up will hold or if it signals an overreaction that could reverse quickly.
The stock is currently trading in the lower range of its 60-day price history, which shows a high of $13.105 and a low of $5.4. The RSI is at 12.74, a level that typically indicates oversold conditions, though this has not yet translated into a breakout in either direction. 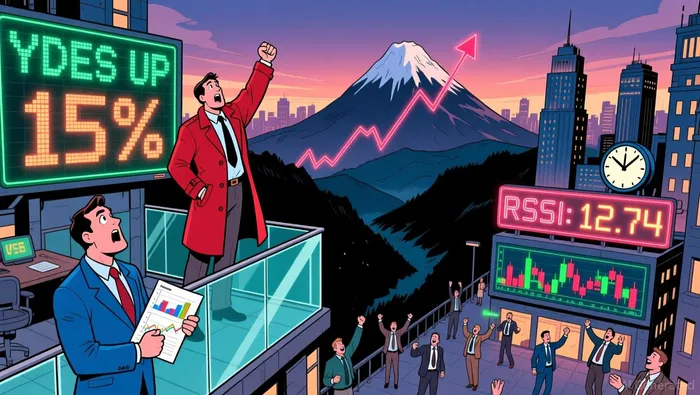 The absence of a clear technical pattern and weak volume signal suggest a high degree of uncertainty about the direction of the stock in the near term.
In short, the move appears abrupt and unconfirmed. Traders are likely watching for follow-through volume and price action to determine whether the move is a valid breakout or a false signal.
What to Watch for in the Next 48–72 Hours?
The next few days will be critical for YDES, as it faces two key price levels. The nearest resistance is at $7.00, which is also a psychological and prior support-turned-resistance level. If the stock can hold above this level with strong volume, it could indicate a more sustainable shift in sentiment. On the other hand, a close below $6.00 would trigger a stronger bearish signal and likely accelerate the return to lower levels.
Volume is expected to be a key determinant. The stock’s relative volume over the last 20 days is at 1.12x the average, which is slightly elevated but still on the lower side of what’s needed for a breakout to be considered valid. If volume expands meaningfully in the next 1–2 sessions, particularly on an upside move above $7.00, that could be a sign of renewed investor interest. Conversely, if volume fails to expand and the stock retests the $6.00 level, it may confirm a more bearish bias.
Market structure also plays a role. The stock is in a defined downtrend, with a 20-day moving average of $7.73 and a 50-day moving average of $9.76. These averages are still well above the current price, reinforcing the bearish bias. A sustained move above $7.00 could begin to reverse this bias, but it would need to hold for multiple sessions to be taken seriously.
In short, YDES is at a decision point. The next 48–72 hours will be telling in whether this move is a genuine recovery attempt or a short-lived false flag.
What to Do if You Own YDES Stock or Are Considering a Position?
For investors already holding YDES, the next few days will be important for determining whether to hold, add, or take profits. The stock’s RSI at 12.74 is in oversold territory, but without volume confirmation, it's hard to say whether this is the bottom or just another consolidation point.
For those considering a position, the $6.00 level is a key watchpoint. A close below this level would likely confirm a breakdown and could accelerate further declines. On the other hand, a close above $7.00 could initiate a short-term rally and bring the stock into more neutral territory.
In either case, the stock is likely to remain volatile. With the ATR at 0.58, swings of 30–50 cents in either direction are not out of the question. That volatility means both risk and opportunity, but it also means that a well-defined trading plan is essential.
The bottom line is that YDES is in a high-pressure environment. Traders should monitor the $6.00 and $7.00 levels closely, with a particular focus on volume and order flow. The next few sessions will likely determine whether this move is just a flash in the pan or the start of a broader recovery.
YDES support and resistance levels
The key support and resistance levels for YDES are as follows:
- Support: $6.00
- Resistance: $7.00
These levels are critical in determining the stock’s immediate direction. A break below $6.00 would likely confirm a bearish bias, while a sustained move above $7.00 could initiate a short-term rally. For now, the stock is trading in a tight range around $6.215, which is just above the $6.00 level. The next few days will be key in determining whether the stock can hold this level or if it will succumb to further weakness.
Stay ahead of the market.
Get curated U.S. market news, insights and key dates delivered to your inbox.
AInvest
PRO
AInvest
PRO
Comments
No comments yet