
XXI Bounced 25% Off the Bottom in a Month—Now $5.20 Decides If It's a Real Rebound or the Next Leg Down
Bitcoin is basically flat. XXI is down 78% from its early listing. That gap is the trade.
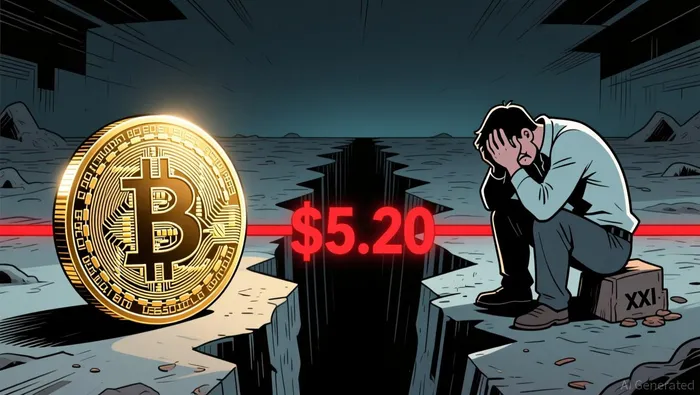
Twenty One Capital (XXI) is trading near $5.70 as of 11:29 a.m. ET on September 2, down about 1.5% on the session. That is not the headline. The headline is that this stock — a pure-play BitcoinBTC-- treasury company that listed on the NYSE in December — has spent the last month doing something its chart hadn't done in months: it went up. Shares gained roughly 26% over the trailing 20 sessions, bottoming near the 52-week low of $4.15 before ripping higher. Now the pullback has arrived, and it has pulled XXIXXI-- straight back down onto the one line that separates a real base from a dead-cat bounce: the 50-day moving average at about $5.20.
Hold $5.20 and the recovery stays alive. Lose it with volume and the people who bought this rebound are suddenly trapped inventory, and there is not much of a floor between here and the old lows.
What you're actually looking at is Bitcoin with a discount dial
Before the levels matter, you have to know what this chart is. XXI is not a business that happens to own Bitcoin — it is Bitcoin exposure in a corporate wrapper. It launched through a merger with Cantor Equity Partners and began trading on December 9, 2025, holding roughly 43,500 BTC at its start, backed by the likes of Tether and SoftBank. The valuation game is not earnings. It's Bitcoin per share: how many coins each share backs, and whether the equity trades at a premium or a discount to that hoard.

That is the crux of the whole setup, because the stock and the coin have badly divorced. Bitcoin sits near $78,000 today — down about $31,000 from a year ago, but roughly flat versus late 2025. XXI, meanwhile, has collapsed from its listing era near $25 to under $6, a ~78% bleed. When Bitcoin recently pushed toward $80,000, the "treasury premium" at bitcoin-holding names like Strategy, Metaplanet, and XXI failed to restore. Translation: the market has been pricing in something beyond the coin itself — most likely the standing threat of more share issuance diluting Bitcoin per share.
So the leverage cuts both ways, but not symmetrically. On rallies, XXI follows Bitcoin hard; on liquidity scares, it falls faster than the coin because the discount widens.
The bounce and the line it now defends
The recent move is real on participation, not just price. Over the trailing 20 sessions XXI climbed roughly 26% — momentum that stood out against a broader tape where the equity had spent months making lower lows. That rally tracked Bitcoin's push toward the $80,000 round trip. And now, with Bitcoin pulling back about 1.7% today, XXI has dropped about 9.4% in just five sessions, handing back a chunk of that month's gain. The rebound high near the low-$6s is the shelf of whoever bought this recovery; today's price has already retreated well below it.
Which is exactly why the 50-day moving average around $5.20 has earned its name. It's not a round number someone drew on the screen. It's the average price of the last two months of trading — meaning it sits right where the overwhelming majority of the people who bought this bounce are concentrated. That's where the "evolutionary" chart of a recovering stock either holds or cracks.
Watch Bitcoin as well, not just XXI. The coin's coalescing action just under the $80,000 level that failed to restore treasury premiums is effectively the underlying driver of every one of these bars.
The trade map
| Scenario | Trigger | Path | Invalidation | Horizon |
|---|---|---|---|---|
| Bounce holds | Hold and reclaim above the high-$5s toward $6 | Reclaim the ~$6.30 pullback origin, trek toward the 200-day near $7.50 | Close back below $5.20 | Days to weeks |
| Recovery fails | Lose $5.20 on rising volume | Fast path toward the low-$4s and the $4.15 52-week low | N/A — thesis broken | Days |
The continuation case needs XXI to take back the low-$6s where the pullback began, and even then the ceiling that matters is the 200-day moving average near $7.50 — the last-resistance slope from the collapse. From $5.70 that is a meaningful, but real, ~30% measured gap if Bitcoin holds. The failure case is cleaner and faster: a decisive close under the 50-day at $5.20, ideally on expanding volume, tells you the rebound was borrowed from a stronger Bitcoin tape rather than owned by XXI specifically. From there, the chart offers little visible support until the low-$4s, where the 52-week bottom at $4.15 sits.
The asymmetry is the whole point: the invalidation, around $0.50 below today's quote, is tight enough to keep the trade honest, and the reward path toward the 200-day is roughly six times that risk — but only if you respect the line. Chasing above the low-$6s after the shelf is already reclaimed is chasing a different, worse setup.
The verdict
Everything runs through $5.20. Hold it into a Bitcoin-stable tape and the +26% rebound has a shot at continuing toward the $6s and the 200-day. Lose it, and the discount widens again, the buyers of the last month get trapped, and the stock heads back to the fours. One line, one close, one decision — and you don't even need to watch the stock to know which way it goes; you can just watch whether Bitcoin can finally hold its $80,000 door.
Data as of 11:29 a.m. ET, September 2, 2026. This reflects reported price action and market structure, not investment advice.

Stay ahead of the market.
Get curated U.S. market news, insights and key dates delivered to your inbox.


AInvest
PRO
AInvest
PRO




Comments
No comments yet