
Is XRP on the Verge of a Final Bull Market Breakout or Imminent Peak?


The debate over XRP’s trajectory in late 2025 hinges on a critical question: Is the asset entering its final leg of a bull market or approaching a peak? To answer this, we must dissect its technical indicators, historical market cycles, and divergent analyst predictions.
Technical Indicators: Mixed Signals Amid Consolidation
XRP’s current technical profile is a tapestry of contradictions. The Relative Strength Index (RSI) stands at 41.95, signaling a neutral stance, while the Stochastic oscillator at 13.86 suggests oversold conditions, hinting at a potential rebound [1]. The MACD and Bollinger Bands indicate bearish momentum, yet proximity to oversold levels raises the possibility of a short-term bounce if the $2.70 support holds [1]. Meanwhile, the 50-day moving average ($3.10) remains above the 200-day moving average ($2.48), reinforcing a bullish trend despite recent weakness [1].
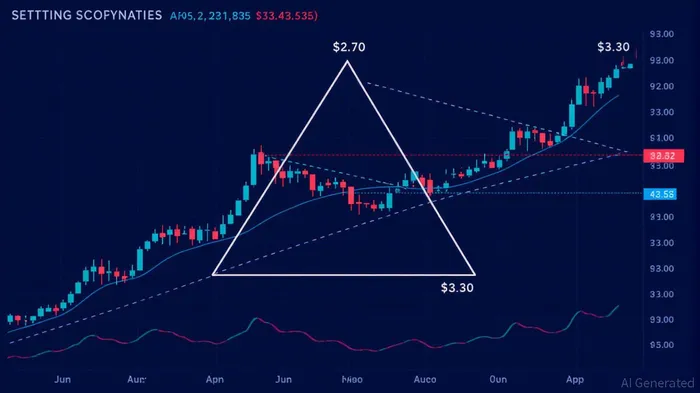
A symmetrical triangle pattern—formed by price oscillations between $2.80 and $3.10—suggests an imminent breakout. Analysts project short-term targets of $3.35 and $3.60 if resistance is breached, with Fibonacci extensions pointing to a potential $4.93 peak [2]. However, on-chain metrics like declining active addresses and whale sales introduce caution [2].
While the MACD line crossing below the signal line (a “death cross”) suggests bearish momentum, historical backtesting of such events since 2022 shows limited predictive power. For instance, 44 death-cross events occurred between 2022 and 2025, with average 30-day returns of +4.8% lagging behind a buy-and-hold benchmark of +8%. These signals alone do not consistently outperform the market [1].
Historical Parallels: Cycles of Consolidation and Breakouts
XRP’s price history reveals a recurring pattern of prolonged consolidation followed by explosive breakouts. For instance, between 2014 and 2017, XRP traded within a descending triangle for three years before surging to $3.30 in January 2018 [3]. Similarly, the 2020–2021 cycle saw a falling wedge pattern culminate in a $1.96 peak [3]. The current 2024–2025 consolidation phase mirrors these historical setups, with XRP breaking above $3 in late 2024 [3].
Technical indicators during past breakouts often showed RSI overbought readings (e.g., 85.81 in July 2025) and MACD bullish crossovers, which historically preceded 25–40% rallies [4]. The current RSI of 41.95, while neutral, is closer to oversold territory than overbought, suggesting a less aggressive breakout scenario compared to 2017 or 2021 [1].
Contrasting Analyst Predictions: $12.60 vs. $37
The disparity between analyst targets—$12.60 and $37—reflects differing assumptions about adoption, regulation, and macroeconomic factors. The $12.60 target is grounded in technical analysis, particularly a symmetrical triangle breakout and Fibonacci projections [5]. Regulatory clarity, including the SEC’s reclassification of XRP as a commodity, has also spurred institutional adoption, with 300+ firms using Ripple’s ODL service [5].
Conversely, the $37 target relies on historical analogies and speculative adoption. Analysts like CryptoBull2020 draw parallels between XRP’s current fractal patterns and the 2015–2018 cycle, suggesting a repeat of past bull runs could drive the price to $37 [6]. This scenario assumes aggressive ETF approvals and a surge in cross-border payment demand, akin to Bitcoin’s 2021 rally [6].
Key Catalysts and Risks
The outcome hinges on three factors:
1. Regulatory Clarity: The SEC’s 2025 decision to reclassify XRP as a commodity has already unlocked institutional capital, but further legal uncertainties could disrupt momentum [5].
2. Institutional Adoption: Ripple’s expansion in cross-border payments and potential ETF approvals could inject billions into the market, mirroring Bitcoin’s ETF-driven surge [5].
3. Macro Conditions: A dovish Federal Reserve and global economic stability would favor XRP’s institutional adoption, while a tightening cycle could cap gains [6].
Conclusion: Final Leg or Imminent Peak?
XRP’s technical indicators and historical cycles suggest a bullish bias, but the magnitude of the move remains uncertain. The $12.60 target appears more grounded in near-term technicals and regulatory progress, while $37 depends on speculative adoption and macroeconomic tailwinds. Investors should monitor $2.70 support and $3.30 resistance as critical junctures. If XRP sustains above $3.30, the $4.93 Fibonacci target becomes plausible; a failure to hold $2.70 could trigger a deeper correction.
In the end, XRP’s trajectory will be defined by whether it mirrors the 2017/2021 breakout patterns or enters a new phase of consolidation. For now, the market is poised at a crossroads—between a final surge and a potential peak.
Source:
[1] XRP Price Drops to $2.73 as Ripple Tests Critical Support [https://blockchain.news/news/20250901-xrp-price-drops-to-273-as-ripple-tests-critical-support]
[2] XRP's Bullish Momentum and Market Structure [https://www.ainvest.com/news/xrp-bullish-momentum-market-structure-strategic-entry-point-2025-investors-2508]
[3] XRP's Historical Price Pattern Repeats with $37 or $180 Price Potential [https://www.ainvest.com/news/xrp-historical-price-pattern-repeats-37-180-price-potential-convergence-cyclical-behavior-institutional-adoption-2508]
[4] XRP on the Rise — Technical Prediction Signals Bullish Breakout [https://m.economictimes.com/news/international/us/xrp-on-the-rise-technical-prediction-signals-bullish-breakout-imminent-as-analysts-target-3-80-surge/articleshow/123322213.cms]
[5] XRP ETF's Surging Dividends and Impending ETF Approval [https://www.ainvest.com/news/xrp-etf-surging-dividends-impending-etf-approval-catalyst-long-term-growth-2508]
[6] XRP Is Falling, But This Crypto Analyst's New Price Prediction Suggests 1,000% Surge [https://www.financemagnates.com/trending/xrp-is-falling-but-this-crpypto-analysts-new-price-prediction-suggests-1000-surge/]
"""
Decoding blockchain innovations and market trends with clarity and precision.
Latest Articles
Stay ahead of the market.
Get curated U.S. market news, insights and key dates delivered to your inbox.

AInvest
PRO
AInvest
PRO
Comments
No comments yet