
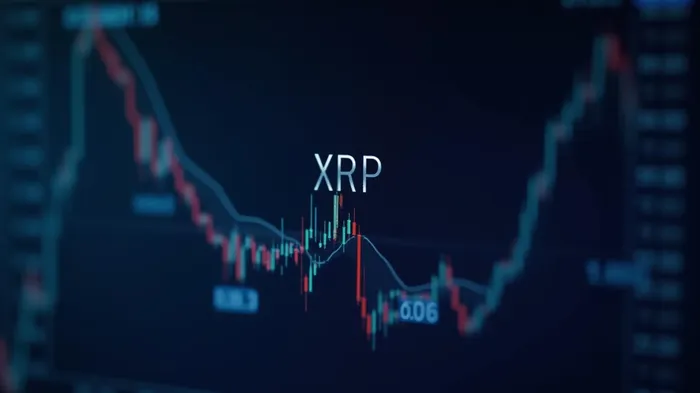
XRP news today: XRP Price Drops 5% as Bearish Momentum Persists
XRP price has been under pressure, failing to maintain its position above the $2.18 resistance level. This has led to a decline below key moving averages and a test of a critical horizontal demand zone. Despite the broader resilience in the crypto market, XRP's price action has remained sluggish, with no significant breakout since early May. Traders are now closely monitoring whether the $2.08–$2.10 support level can withstand the ongoing downward pressure or if further retracements are imminent.
The 4-hour chart of XRP/USD reveals a clear rejection from the $2.24 zone, which aligns with both the 0.236 Fibonacci level and the upper Bollinger Band. This rejection was followed by a downward slope beneath the 20, 50, and 100 EMAs, which converge near $2.17–$2.18, now acting as short-term resistance. A bearish pennantPNTG-- breakdown on the 30-minute chart has further accelerated the downside pressure, confirming the loss of bullish momentum.
Support between $2.08 and $2.10 is currently holding, bolstered by an earlier demand cluster and the 0.382 Fibonacci retracement from the April impulse move. A breach below this level could quickly push XRP price into the $1.98–$2.00 zone, marking the 0.5 Fib level and the next major liquidity zone. On the upside, a reclaim of the $2.18 mark is required to ease the current bearish bias. Until then, range-bound movement within $2.08–$2.18 is the most probable outcome for XRP price today.
Momentum indicators on the 4-hour chart highlight prevailing weakness. The RSI reads at 36.37, deep in bearish territory, while the MACD histogram shows persistent red bars with the signal line below zero. These signals align with the broader bearish trend and validate the short-term XRP price volatility. However, the Stochastic RSI is now hovering around the 20 mark, potentially signaling an oversold condition. This suggests a minor bounce is possible if buyers defend the $2.10 floor, though upside will likely face rejection around the $2.17–$2.18 resistance band.
Bollinger Bands are also tightening, indicating that a volatility expansion is likely imminent. Whether this resolves in a bullish or bearish direction will depend on whether XRP price can reclaim its EMAs or loses the $2.08 handle. From a broader perspective, the daily chart shows a textbook rejection from the 0.236 Fibonacci level at $2.18, followed by a slow descent toward the 0.382 and 0.5 levels. The 0.5 Fib ($1.98) and 0.618 Fib ($1.89) remain key zones for any larger correction. These levels coincide with previously tested demand areas during late April and would be watched by swing traders for potential long re-entries.
If the question is why XRP price is going down today, the answer lies in the confluence of trendline rejections, EMA failures, and weakening RSI momentum. No clear fundamental news has driven this dip, making the move largely technical. According to the analyst's forecast, the bearish case scenario is likely to drive XRP into the next Fib zone at $1.98 if the $2.10 support is lost. The neutral range scenario is likely to be short-term unless bulls reclaim the EMA cluster and horizontal zone. The bullish breakout scenario requires strong volume and reclaim above 20/50 EMA and trendline resistance.
Stay ahead of the market.
Get curated U.S. market news, insights and key dates delivered to your inbox.


AInvest
PRO
AInvest
PRO
Comments
No comments yet