
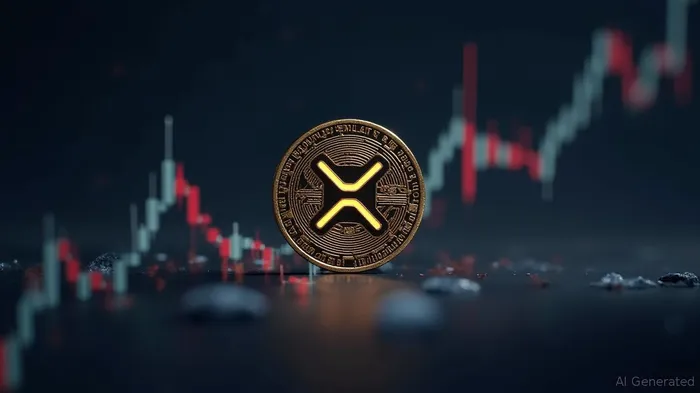
XRP News Today: XRP Faces Crucial Support Test at $2.07 Amid Bearish Sentiment
An analyst has identified $2.07 as a crucial support level for XRP, suggesting that if this level holds, the cryptocurrency could potentially reach $3.00. The Relative Strength Index (RSI) for XRP has declined from 68 to 41 since May 12, indicating a growing bearish sentiment. This decline in RSI suggests that the selling pressure on XRP has increased, which could be a sign of a potential reversal if the support level at $2.07 holds.
The analyst's prediction is based on the formation of a double bottom pattern, which is a technical analysis indicator that suggests a reversal in the downward trend of an asset. A double bottom pattern occurs when the price of an asset forms two consecutive lows at approximately the same level, followed by a rally. If the price of XRP can break above the resistance level formed by the highs between the two lows, it could signal a bullish reversal and potentially propel the price towards the $3.00 target.
According to the analyst, if XRP maintains support above $2.07, it could revisit $2.30 and potentially hit breakout targets of $2.50, $2.65, and $3.00. These targets coincide with key resistance levels noted earlier this year. However, if XRP drops below the $2.07 support, the bullish outlook could weaken, potentially resulting in a more serious correction to the $1.80 or $1.50 range.
Elliott Wave counts on the chart also indicate a completed ABC correction and the potential onset of a new bullish impulse wave. If confirmed, this wave could extend beyond the $3.00 level toward long-term projections of approximately $3.80 to $4.00 based on historical Fibonacci extensions. However, recent technical signals suggest caution. An inverted V-shaped correction is forming on the daily chart, with the RSI decreasing from 68 to 41 since May 12. This indicates diminishing bullish strength and raises the likelihood of a short-term drop toward the $1.70 area.
In another analysis, the analyst has reignited bullish sentiment within the XRP community with a striking new projection suggesting the asset could surge toward $10.70 and potentially as high as $55. The analysis identifies XRP’s current phase as “Move 1,” historically a precursor to parabolic growth. The use of fractal patterns suggests that XRP might be repeating a past bullish cycle, creating the opportunity for a decisive breakout. Coupled with Ripple’s growing institutional partnerships and renewed vigor in the altcoin market, the chart has ignited fresh enthusiasm, although analysts advise caution due to ongoing market uncertainties.
It is important to note that technical analysis is not a foolproof method of predicting the future price of an asset, and that there are many other factors that could influence the price of XRP in the coming days and weeks. For example, news events, regulatory developments, and changes in market sentiment could all have an impact on the price of XRP. Additionally, the analyst's forecast is based on the current market conditions and may not take into account any potential changes in the market that could occur in the future. For example, if there is a sudden increase in demand for XRP, or if there is a significant development in the Ripple ecosystem, this could potentially drive the price of XRP higher than the $3.00 target.
Overall, while the analyst's forecast is based on sound technical analysis principles, it is important for investors to conduct their own research and analysis before making any investment decisions. It is also important to remember that investing in cryptocurrencies is inherently risky, and that there is always the potential for significant losses. Therefore, investors should only invest money that they can afford to lose, and should always be prepared for the possibility of a market downturn.
Stay ahead of the market.
Get curated U.S. market news, insights and key dates delivered to your inbox.

AInvest
PRO
AInvest
PRO
Comments
No comments yet