
XRP News Today: XRP Faces Critical Breakout Window July-September 2025
XRP, the third-largest cryptocurrency by market cap, has seen a significant rally over the past year, surpassing both Bitcoin and Ethereum with a 359.9% increase. However, 2025 has brought a period of consolidation, with only a 0.45% uptick in Q1 and a 4.11% gain so far in the current quarter. Technical analysts are closely monitoring the situation, as a potential breakout could redefine XRP’s trajectory for the rest of the year.
Recent technical analysis reveals a symmetrical triangle pattern on XRP’s daily chart, indicating a period of consolidation where both buyers and sellers are in a standoff. This pattern is considered neutral, meaning XRP could break out in either direction—upward or downward. The upper trendline connects declining highs, while the lower trendline connects rising lows. This pattern typically spans 334 days, and breakouts usually occur between 75% and 95% of the pattern’s duration. According to crypto analyst EGRAG CRYPTO, the most likely breakout period is from early July to mid-September 2025.
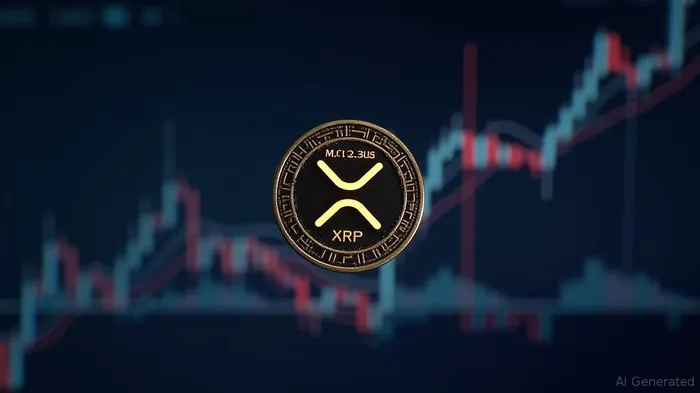
The direction of the breakout will be crucial for XRP’s future. In a bullish scenario, if XRP breaks above the upper trendline, the target could be $5 or more. Conversely, in a bearish scenario, if XRP falls below the lower trendline, support could be around $2 or lower. The current price of XRP is $2.18, with a 24-hour increase of 8.2%, a 7-day change of -2.6%, and a 14-day change of -4.7%.
Investors should be aware that the consolidation phase may be ending, and volatility is likely ahead. The symmetrical triangle suggests a significant move is coming, making the July–September 2025 window a critical period to watch. With the breakout window fast approaching, XRP holders and traders should stay alert. A move above or below the triangle could signal the beginning of a new trend, potentially propelling XRP to new highs near $5 or triggering a retracement near key support levels.
XRP is currently at a critical juncture, with technical indicators suggesting both potential bullish and bearish outcomes. The token has experienced negative closes over the past two weeks, resulting in an 11% loss and bringing it closer to the apex of a seven-month descending triangle pattern. This pattern suggests that the price is poised for a significant move, either upwards or downwards.
The bearish scenario predicts a 44% crash to $1.05 if the price breaks below the key support level of $1.89. This breakdown would be confirmed by a decisive three-day candlestick close below $1.89, coupled with high trading volume. However, the price may pause around $1.46 to $1.40 due to an order block formed in late November 2024, which could act as a temporary support zone.
On the other hand, the bullish case is supported by several factors. Santiment’s blockchain data shows a spike in Daily Active Addresses (DAA), indicating renewed investor interest during recent dips. Historically, similar spikes in DAA have been followed by significant price rallies. Additionally, the recent crash in Bitcoin price to retest $100,000 has created a potential bounce-back scenario. If Bitcoin recovers from this level, it could positively impact XRP and other cryptocurrencies, making a crash less likely. Furthermore, the air around the SEC vs. Ripple lawsuit settlement delays till 2026 has been cleared, providing another reason for an XRP price recovery.
Investors are advised to watch for Bitcoin's price movements and XRP's breakout volume for directional bias. The outlook for XRP remains bullish despite the bearish predictions from the descending triangle pattern. However, caution is advised as Bitcoin sits above $100K, a critical level that could decide the fate of the crypto markets.
Stay ahead of the market.
Get curated U.S. market news, insights and key dates delivered to your inbox.

AInvest
PRO
AInvest
PRO
Comments
No comments yet