
XRP News Today: XRP Faces Bearish Momentum as Peter Brandt Identifies Head and Shoulders Pattern
Market veteran Peter Brandt has identified a potential head and shoulders pattern on the weekly XRP chart, highlighting the factors that could trigger a bearish momentum. XRP is currently at a critical juncture following a significant drop linked to global tensions. The broader crypto market experienced a downturn when the United States conducted airstrikes on several nuclear facilities in Iran, intensifying the ongoing conflict between Iran and Israel.
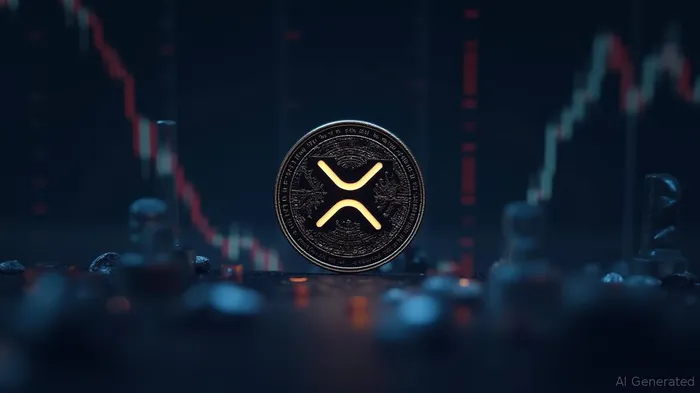
Currently, XRP is trading around $2.03, a fragile position. Veteran trader Peter Brandt noted a possible Head and Shoulders (H&S) pattern on the one-week chart, a structureGPCR-- that often signals a shift to bearish momentum. Brandt identified the sharp dip to $1.61 on April 7 as an anomaly caused by heightened volatility rather than part of the pattern. Removing this outlier, the H&S structure appears more intact and consistent.
The pattern began forming at the end of last year. The left shoulder formed in December 2024 when XRP hit $2.9 and corrected. The head formed in January 2025 during a higher surge to $3.4. The right shoulder formed during the rise to $2.65 in May 2025. A solid horizontal neckline sits at $1.875, and XRP is currently trading just above this level. Brandt emphasized that this does not automatically mean the price will drop. However, he plans to re-evaluate his stance if XRP closes below the $1.80 range on the weekly chart, which could confirm the pattern and invite deeper losses.
Several indicators suggest the market is in a state of indecision. For instance, the 8-week and 18-week exponential moving averages have flattened and now run close together, indicating fading momentum. The ADX, which tracks trend strength, sits at a soft 16.41, well below the threshold for a strong trend. Meanwhile, the Average True Range reads 0.486, indicating that volatility has cooled down. When price action tightens like this, it often leads to a significant move in either direction.
As XRP maintains this position, multiple analysts are discussing its potential direction. CryptoInsightsUK focused on the liquidity building up around $1.87 and predicted that XRP might dip slightly below that level to shake out weak hands. He mentioned that if XRP dropped as low as $1.72, it could present an ideal buying opportunity. At the same time, he urged traders to watch the liquidity sitting above current levels, suggesting that any upward move from here could trigger a strong rally.
In an earlier report, analyst EGRAG said XRP successfully tested a major support zone, which he calls the “white box” during the latest downward push. EGRAG sees this development as a bullish sign. He presented two likely paths: either XRP continues correcting or it bounces toward new highs. He also warned that if XRP fails to reclaim the $2.08 level, it could slide to $1.90 or even $1.77. If the market turns more bearish, $1.47 might serve as the next key support level.
Stay ahead of the market.
Get curated U.S. market news, insights and key dates delivered to your inbox.

AInvest
PRO
AInvest
PRO
Comments
No comments yet