XRP news today: XRP's Bullish Flag Pattern Suggests 25% Price Surge
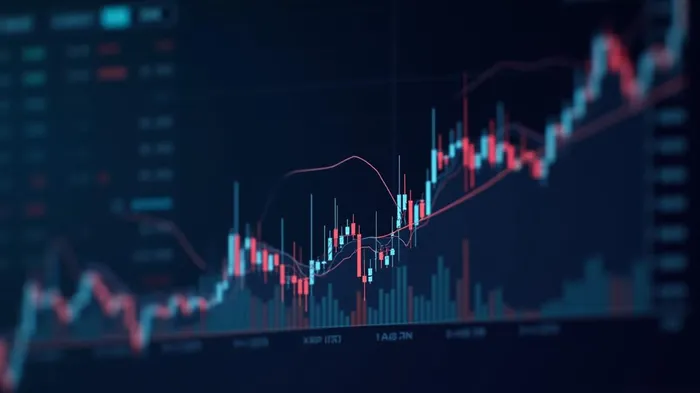
Edward Farina, the CEO of Alpha Lions Academy, recently shared a chart on X, highlighting what he described as a “bullish flag” pattern for XRP. The chart, which appears to be from 2021, shows a significant upward movement in XRP’s price, followed by a consolidation phase bounded by two parallel trendlines. This pattern is often identified in technical analysis as a bullish flag, indicating the potential for continued upward momentum following a brief corrective period.
Farina’s interpretation suggests that the current positioning of the price within this pattern could signify an impending surge. His “bullish flag” indicates optimism in the price action and hints at expectations for a breakout above the consolidation channelCHRO--.
Other users on the X platform contributed their observations in response to Farina’s post. A user identified as Nexus Token elaborated on the nature of the bullish flag pattern using recent price action. According to Nexus Token, in the past week, XRP shot up from about $1.85 to $2.30, then consolidated in a $2.10–$2.30 range, sloping slightly down. Volume dropped during this pullback, fitting a classic ‘bull flag’: sharp pole, then a flag-shaped consolidation. This explanation aligns with textbook definitions of the pattern, where a steep initial rise is followed by a tight, downward-sloping range and a decrease in trading volume. The implication is that a breakout from this consolidation could initiate another significant upward movement, contingent on volume and price action confirmation.
What Farina shared depicts the XRP price behavior around late 2020 to mid-2021. During that period, XRP experienced a major rally followed by several corrective phases. While this historical reference may not reflect the exact current market dynamics, it appears that Farina used the past chart to suggest a similar structural behavior could be occurring again. Using historical patterns to draw inferences about future price movements is a common practice in technical analysis. In this case, Farina’s tweet does not explicitly claim that current XRP price action is forming the same pattern, but the implication is that the past setup may offer a model for interpreting the present market.
XRP, the cryptocurrency developed by Ripple Labs, is currently in a consolidation phase, according to expert analysis. This phase is characterized by a period of sideways price movement, where the asset neither significantly appreciates nor depreciates in value. The expert's observation of a "bullish flag" pattern suggests optimism in the price action, indicating that the market is preparing for a potential breakout above the current consolidation channel.
The bullish flag pattern is a technical chart formation that typically signals a continuation of an existing uptrend after a brief period of consolidation. This pattern is characterized by a sharp price increase followed by a period of sideways movement, forming a flag-like shape on the chart. The expert's identification of this pattern in XRP's price action suggests that the market is building momentum for a potential upward move.
The consolidation phase is a natural part of the price cycle for many assets, including cryptocurrencies. During this phase, the market takes a breather from the previous price action, allowing for a period of stabilization before the next significant move. This phase is often marked by reduced volatility and trading volume, as market participants take a wait-and-see approach.
The expert's analysis of XRP's price action comes at a time when the overall cryptocurrency market is experiencing increased volatility and uncertainty. The recent surge in interest in cryptocurrencies, driven by factors such as institutional investment and regulatory developments, has led to significant price movements in many assets. However, the expert's analysis suggests that XRP is currently in a period of relative stability, with the potential for a significant upward move in the near future.
The expert's analysis of XRP's price action is based on technical analysis, a method of evaluating assets by analyzing statistical trends gathered from trading activity, such as price movement and volume. Technical analysis is widely used by traders and investors to identify potential opportunities in the market, and the expert's identification of a bullish flag pattern in XRP's price action is a clear indication of the asset's potential for future growth.
The expert's analysis of XRP's price action is a reminder of the importance of technical analysis in evaluating cryptocurrencies. While fundamental analysis, which focuses on the underlying value of an asset, is also important, technical analysis provides valuable insights into the market's sentiment and potential future price movements. By combining both methods, investors and traders can make more informed decisions about their investments in cryptocurrencies.

Comprender rápidamente la historia y el desarrollo de diversas monedas de gran relieve
Latest Articles
Stay ahead of the market.
Get curated U.S. market news, insights and key dates delivered to your inbox.


Comments
No comments yet