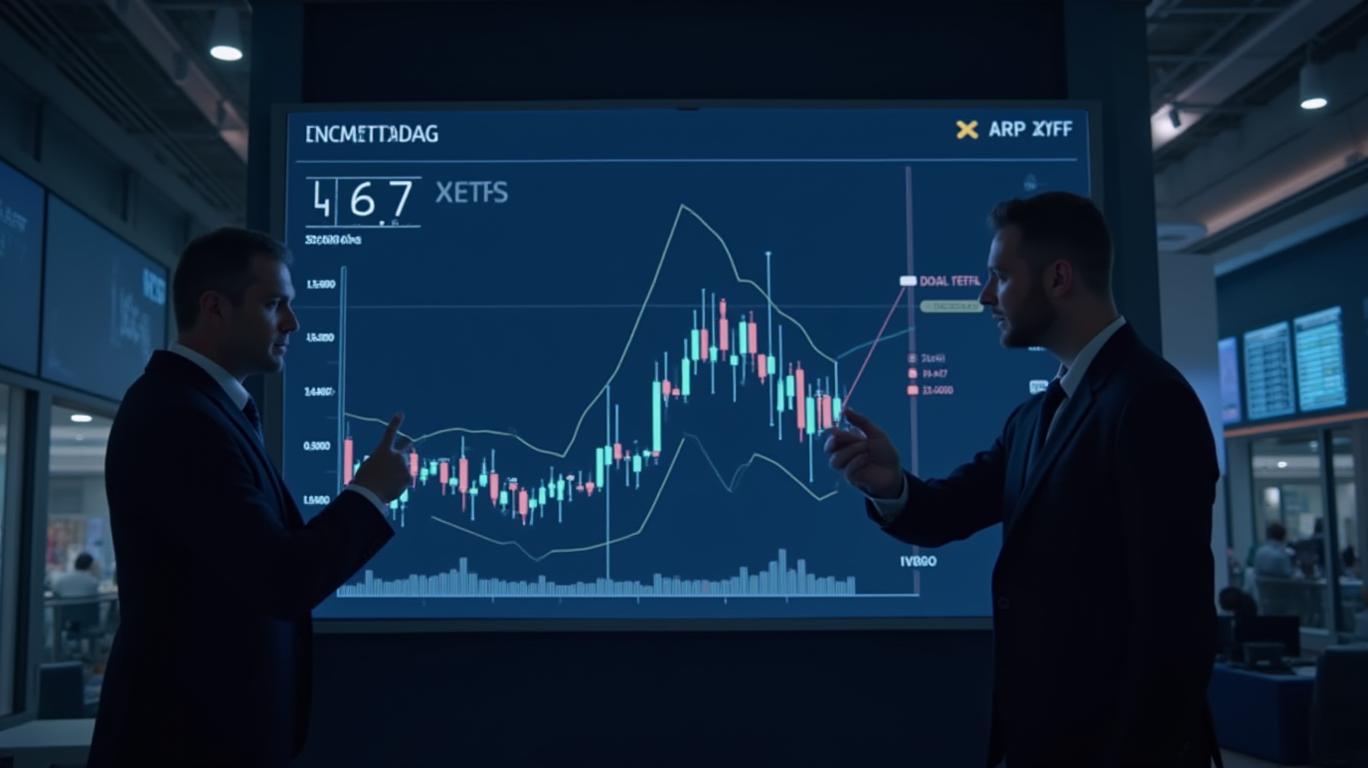
XRP Bulls Eye $4.77 as Falling Wedge Pattern Emerges
In the dynamic world of cryptocurrency, XRP, the digital asset associated with Ripple, has recently garnered significant attention due to emerging bullish patterns that suggest a potential upward trajectory. Notably, analysts have identified the formation of a falling wedge pattern, indicating a possible price surge shortly.
Understanding the Falling Wedge Pattern
According to market analysts, a falling wedge is a technical chart pattern characterized by converging trendlines that slope downward, encompassing a series of lower highs and lower lows. This pattern typically signifies a slowdown in the downward momentum, often preceding a bullish reversal. The narrowing of the wedge indicates diminishing selling pressure, setting the stage for a potential breakout to the upside.
XRP Chart/ CryptoBull
As of January 13, 2025, XRP is trading at approximately $2.92, with an intraday high of $3.07 and a low of $2.91. The recent price movements have led to a falling wedge pattern, which analysts interpret as a precursor to a bullish breakout.
Analysts suggest that a successful breakout from this pattern could propel XRP’s price to around $4.77, aligning with projections from prominent market observers. This target is derived by measuring the height of the wedge at its widest point and adding it to the anticipated breakout level.
Historical Context and Future Projections
Historically, XRP has exhibited significant price surges following the completion of similar technical patterns. For instance, during the 2014 to 2018 market cycle, XRP experienced a remarkable ascent from $0.002 to an all-time high of $3.84, marking a staggering 191,900% increase over nearly four years. This historical precedent underscores the potential for substantial gains should the current pattern resolve bullishly.
While some analysts have posited ambitious targets, with projections reaching as high as $154 based on long-term trend analyses, more conservative estimates place the next significant resistance around the $4.77 mark. However, considering the volatility of the cryptocurrency landscape, it’s important to approach such forecasts with caution.
Market Sentiment and Investor Considerations
The current sentiment 
Quickly understand the history and background of various well-known coins
Latest Articles
Stay ahead of the market.
Get curated U.S. market news, insights and key dates delivered to your inbox.


Comments
No comments yet