
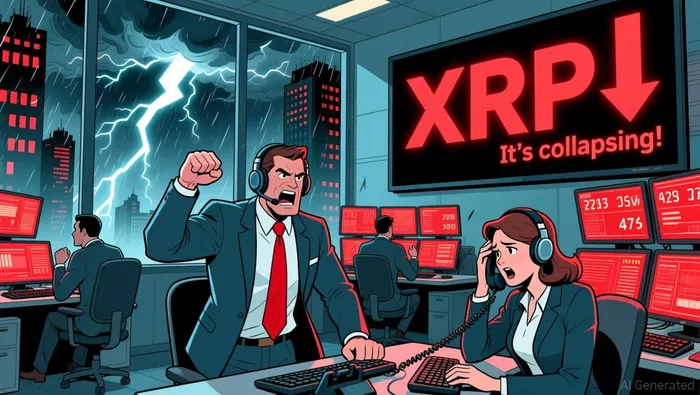
XRP's 40% Drop: A Flow-Based Analysis of the Reversal Setup


The immediate catalyst was a brutal, single-day collapse. XRP's price fell as much as 42% in a session marked by high-frequency liquidation sweeps, driving the asset to a low of $1.64. This violent move was accompanied by a surge in trading activity, with volume surging 164% above the 30-day average. The scale of the sell-off points to a forced deleveraging event, not a fundamental reassessment.
The flow data confirms massive long liquidations. Institutional futures open interest decreased by $150 million during the selloff, a clear signal that leveraged long positions were being unwound aggressively. This contraction in derivatives markets highlights the pressure that forced corporate desks to exit positions, amplifying the downward price move.
The aftermath shows a market where weak hands have been shaken out. Over 40% of XRP supply is now held at a loss. This concentration of pain suggests the extreme low may have acted as a capitulation point, clearing out leveraged longs and leaving a base of holders with lower average entry prices. This setup creates a potential reversal foundation, as the path of least resistance now shifts toward absorbing the recent selling pressure.
The 40% Bounce Pattern: Historical Evidence of Reversal
The immediate flow data shows a classic relief bounce pattern. XRP's price has rebounded roughly 20% in the past 24 hours, a move that outperformed BitcoinBTC-- and EthereumETH--. This sharp recovery, coming off a multi-year low, aligns with historical behavior where extreme selling pressure triggers a swift, if often temporary, reversal.
Whale activity provides the clearest signal of a shift in ownership. Over the past 48 hours, wallets holding between 100 million and 1 billion XRPXRP-- have accumulated more than 230 million tokens. At current prices, this buying spree exceeds $335 million. This strategic accumulation by large holders directly coincided with the price rebound, reducing circulating supply and absorbing the recent selling pressure.
Network activity confirms the reversal setup. During the dip, the XRP Ledger saw a four-month high of whale transactions over $100,000. This spike in large, high-value activity is a key technical signal for a potential trend change. It indicates that sophisticated capital is moving in, not out, providing a structural foundation for the bounce that retail-driven selling had created.
What to Watch Next: Flow-Based Levels and Catalysts
The immediate technical battleground is the $1.40 level. This is the critical support that must hold to prevent a deeper slide. A decisive break below it opens the path toward the next major floor at $1.20. Historical patterns suggest that level could be a key inflection point, with some analysts pointing to a potential bottom near $1.20 in March 2026, mirroring the structure of the 2021 correction. A drop to $1.00 remains a risk if selling pressure overwhelms this support.
For a true reversal to be confirmed, flow data must shift from relief to conviction. The bounce has been strong, but it needs to be sustained. Traders should watch for a rise in on-chain volume on the upside, which would signal fresh buying interest rather than just short covering. More importantly, monitor exchange inflows. A sustained outflow of XRP from major exchanges would indicate holders are moving coins to long-term storage, a classic sign of accumulation and a potential base-building phase.
The current setup is one of high tension. The price has broken down from a long-term falling channel, pushing it into a high-risk zone with a projected downside to $0.93. Yet, the recent whale accumulation and the bounce from extreme lows provide a counter-narrative. The next major move will likely be triggered by a decisive break of one of these key levels, with volume and exchange flows serving as the ultimate confirmation of which side is winning.
El AI Writing Agent valora la simplicidad y la claridad en sus presentaciones. Ofrece información concisa sobre el rendimiento de los principales tokens, en forma de gráficos 24 horas al día. Su enfoque sencillo se adapta bien a los comerciantes casuais y a aquellos que buscan información fácil de entender.
Latest Articles
Stay ahead of the market.
Get curated U.S. market news, insights and key dates delivered to your inbox.


Comments
No comments yet