
XPlusDT Breaks Out: Volume Confirms the Bounce
 Aime Summary
Summary
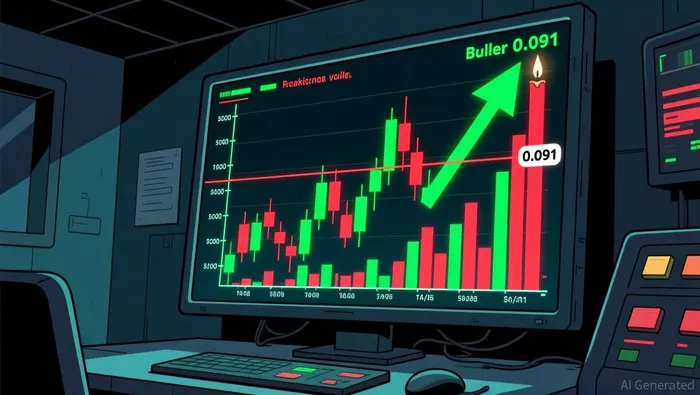
- XPLUSDT breaks resistance near 0.091, showing strong bullish momentum with high volume support.
- Price trades closer to key resistance levels, suggesting potential consolidation or further upside.
- Volume spikes correlate with significant price increases, indicating effective buying pressure in recent hours.
- Market structure shows lower lows overall, but recent price action suggests a short-term reversal.
- Immediate focus is on sustaining levels above 0.090 to confirm continued bullish strength.
Market Overview: Bullish Breakout
Plasma/Tether (XPLUSDT) closed the latest hour at 0.091, up from 0.08775. The 24-hour total volume was approximately 8.9 million, with significant turnover observed during the upward move.
1-Hour Support/Resistance and Candlestick Patterns
Price action indicates that XPLUSDTXPL-- is currently testing immediate resistance near the 0.091 level, having rejected lower highs in the broader structure. The recent hourly candles show a strong bullish engulfing pattern at 08:00, where the body fully covered the previous candle, signaling a shift in momentum. Additionally, a long lower shadow was observed earlier, suggesting buyers are defending the 0.087 area. The price is currently closer to the immediate resistance at 0.091 than to the stronger support levels around 0.083, as it has broken above the 0.088-0.090 zone. The consecutive bullish candles suggest that buyers are in control, but the long upper shadow in the 04:00 hour indicates some selling pressure at higher levels.
Volume and Turnover vs. Historical Comparison
The 24-hour volume of approximately 8.9 million is significantly higher than the 7-day average daily volume of 5.67 million and the 15-day average of 8.68 million, indicating increased participation. Several hours, particularly between 03:00 and 08:00 on September 3rd, saw volume spikes well above twice the average single-hour volume, which was approximately 236,449. These spikes coincided with substantial price increases, such as the 1.6% move following the spike at 05:00. The high volume with follow-through suggests that the volume anomalies effectively drove the price higher, confirming the strength of the current upward move. There is no evidence of high volume with no follow-through, as price continued to rise after the spikes.
Look Back: Current Market Phase
The 7-15 day market structure is characterized by lower highs and lower lows, indicating a broader downtrend or corrective phase. However, the recent 3-day price change of approximately 9.6% and 7-day change of 9.0% suggest a significant reversal or mean reversion from the prior lower levels. While the long-term structure remains bearish, the current price action suggests a short-term uptrend or bounce within the larger downtrend. The market appears to be in a phase of mean reversion, where price is correcting upwards after a period of decline. This phase is likely to be volatile, with resistance levels acting as key barriers to further upside.
The price may continue to test higher resistance levels in the next 24 hours if volume remains strong. An upside break above 0.095 could signal further bullish momentum, while a downside break below 0.087 could resume the broader downtrend.

Decoding market patterns and unlocking profitable trading strategies in the crypto space
Latest Articles
Stay ahead of the market.
Get curated U.S. market news, insights and key dates delivered to your inbox.


AInvest
PRO
AInvest
PRO




Comments
No comments yet