
Xpeng Rises 3.26% as Bullish Candlestick Patterns and Moving Averages Signal Short-Term Gains Amid Overbought Indicators
Xpeng (XPEV) closed the most recent session at $21.83, reflecting a 3.26% increase. This upward move aligns with a broader technical backdrop of mixed signals across multiple timeframes, warranting a layered analysis to assess its sustainability and potential risks.
Candlestick Theory
The recent bullish candle with a long upper shadow suggests a test of resistance near $21.99, with a closing price above the session’s midpoint indicating moderate conviction. Key support levels are identified at $20.36 (prior low on November 21) and $18.83 (December 2024 trough), while resistance clusters at $25.01 (November 14 high) and $22.62 (November 18 peak). A bearish engulfing pattern on November 20 (closing at $20.09) contrasts with the current bullish setup, highlighting a potential tug-of-war between short-term buyers and lingering bearish sentiment.
Moving Average Theory 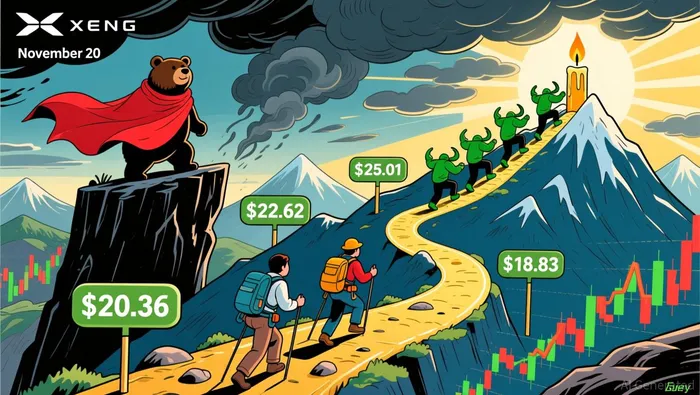 The 50-day moving average (approximately $21.50) and 200-day MA (around $19.50) suggest a short-term bullish bias, as the stock remains above both. The 100-day MA (~$21.20) reinforces this, with the price currently in a shallow uptrend. However, the 200-day MA’s lagging nature implies that long-term investors remain cautious. A break above $22.62 could trigger a retest of the 50-day MA, while a close below $20.36 might invite a reevaluation of the trend.
MACD & KDJ Indicators
The MACD histogram shows a narrowing bearish divergence, with the line crossing above the signal line in late November, suggesting strengthening momentum. Conversely, the KDJ oscillator entered overbought territory (K=85, D=78) on November 28, raising caution about a near-term pullback. While the MACD supports continuation, the KDJ’s overbought condition hints at a potential correction, particularly if volume fails to confirm further gains.
Bollinger Bands
Volatility has expanded recently, with the bands widening after a period of contraction in early November. The current price near the upper band ($21.99) indicates heightened volatility and potential exhaustion of the upward move. A reversal scenario becomes more likely if the price closes below the middle band ($21.50), which would align with a retest of the $20.36 support level.
Volume-Price Relationship
The recent surge was accompanied by elevated volume ($131.79 million), reinforcing the validity of the rally. However, volume has not consistently expanded on higher closes in the preceding sessions (e.g., November 26 and 25), suggesting mixed conviction. A surge in volume during a pullback could signal accumulation, but declining volume on new highs might indicate weakening momentum.
Relative Strength Index (RSI)
The RSI stands at ~65, hovering near overbought territory but not yet exceeding 70. This suggests the rally has room to extend but warns of potential exhaustion if the index closes above 70 without a corresponding price breakout. A drop below 50 would signal a shift in momentum, with the 30 level (currently ~$16.50) serving as a critical oversold threshold.
Fibonacci Retracement
Key Fibonacci levels from the December 2024 low ($11.82) to the November 11 high ($28.23) include 50% at $20.03 and 61.8% at $19.03. The current price ($21.83) suggests a 38.2% retracement, indicating a potential pullback to test the 50% level. A break below $20.03 could accelerate a decline toward $18.83, while a sustained move above $25.01 would invalidate the bearish scenario.
Confluence and Divergence
Confluence between the 50-day MA and Fibonacci 50% level at ~$20.03 suggests a pivotal inflection point. However, a divergence between the overbought KDJ and the MACD’s bullish signal introduces caution, as momentum may stall before a full reversal. The Bollinger Bands’ expansion and elevated RSI further underscore the need for a consolidation phase.
Conclusion
Xpeng’s recent rally is supported by bullish candlestick patterns and moving averages but faces resistance at $22.62 and $25.01. While the MACD suggests continuation, the KDJ’s overbought condition and RSI’s proximity to 70 imply a high probability of a near-term correction. Traders should monitor volume during pullbacks and key Fibonacci levels for potential confluence with moving averages, as these may define the next directional move.
If I have seen further, it is by standing on the shoulders of giants.
Latest Articles
Stay ahead of the market.
Get curated U.S. market news, insights and key dates delivered to your inbox.
AInvest
PRO
AInvest
PRO
Comments
No comments yet