
Xeleb Protocol Trapped in Range as Volume Fades
 Aime Summary
Summary
- Xeleb Protocol trades in a tight range near 0.003316 with mixed bullish and bearish engulfing signals.
- Volume remains below 7-day average, indicating low participation and potential consolidation phase.
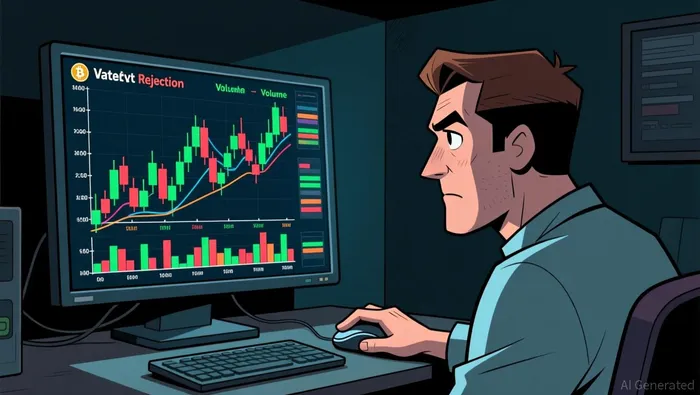
- Price action shows rejection at resistance, suggesting sellers are defending key levels effectively.
- Market structure appears range-bound with no clear directional momentum in the short term.
- Caution advised as lack of volume follow-through limits significant price breakout potential.
Range Bound Consolidation
Xeleb Protocol/Tether (XCXUSDT) closed the latest hour at 0.003316, reflecting a slight pullback from the 02:00 high of 0.003450. The 24-hour trading volume totaled approximately 35.6 million USDT, indicating subdued market activity compared to historical averages.
1-Hour Support/Resistance and Candlestick Patterns
Price action exhibits clear rejection behavior at the 0.003370 level, where multiple candles displayed long upper shadows, indicating seller presence. The most recent candle at 03:00 closed at 0.003316 after testing highs near 0.003470, creating a long upper shadow that exceeds twice the body length, a classic rejection signal. Support is currently being tested around 0.003280 to 0.003300, where the price found buyers earlier in the session. The market structure shows price is currently closer to the immediate support zone than the stronger resistance at 0.003450. Candlestick patterns reveal alternating bullish and bearish engulfing formations throughout the day, suggesting indecision. Specifically, a bullish engulfing pattern appeared at 00:00, followed by a bearish engulfing at 03:00, highlighting the ongoing tug-of-war between buyers and sellers. The presence of these opposing patterns reinforces the view that the market is trapped in a consolidation phase without a clear breakout bias.
Volume and Turnover vs. Historical Comparison
The 24-hour total volume of approximately 35.6 million USDT is notably lower than the 7-day average daily volume of 51.0 million USDT and the 15-day average of 49.1 million USDT. This deficit suggests that current market participants are not driving significant momentum. When examining hourly volume, the highest single-hour volume recorded was 2.80 million USDT at 02:00. This figure is approximately 1.3 times the 7-day average hourly volume of 2.12 million USDT, meaning no hour experienced a volume spike exceeding 2 times the average. The 02:00 volume spike coincided with a price increase to 0.003450, but the subsequent hour at 03:00 saw a sharp price drop to 0.003316 despite lower volume, indicating that the earlier buying pressure lacked follow-through. This lack of sustained high volume confirms that the recent price movements are likely driven by low-liquidity conditions rather than strong institutional interest. Consequently, the volume anomalies did not effectively drive a sustained directional trend, supporting the conclusion of a weak, range-bound market.
Look Back: Current Market Phase
Analyzing the 7-day and 15-day data reveals a market that is primarily range-bound. The 7-day price change is positive at 7.28%, while the 3-day change is slightly negative at -1.07%, indicating a recent pause in the short-term uptrend. The 15-day daily price range is reported as 0.0, which typically signifies a tight trading corridor in the dataset. The market structure feature explicitly identifies the current state as "range bound." The price has not established a clear sequence of lower highs and lows to confirm a downtrend, nor has it consistently made higher highs to confirm a strong uptrend. Instead, the price oscillates within a defined channel, reacting to support and resistance levels with equal frequency. This behavior is characteristic of a mean reversion phase where the asset trades within a established range rather than trending. The current consolidation suggests that the market is accumulating energy or waiting for a catalyst to break out of the current bounds.
The market appears likely to continue oscillating within the 0.003280 to 0.003450 range over the next 24 hours. A break below 0.003280 could trigger downside risk toward 0.003200, while a sustained move above 0.003450 may signal a bullish breakout attempt.

Decoding market patterns and unlocking profitable trading strategies in the crypto space
Latest Articles
Stay ahead of the market.
Get curated U.S. market news, insights and key dates delivered to your inbox.


AInvest
PRO
AInvest
PRO




Comments
No comments yet