
XAN Volume Spikes, But Buyers Fail to Sustain Momentum
 Aime Summary
Summary
- Price consolidates near resistance after recent volatility.
- Volume spikes show mixed directional follow-through.
- Market structure remains range-bound with defined levels.
- Support holds at 0.0133 with rejection wicks.
- Caution advised on breakout confirmation.
Market Overview
Anoma/Tether (XANUSDT) closed the last hour at 0.013327, with 24h volume reaching 12.5M USDT.
1-Hour Support/Resistance and Candlestick Patterns
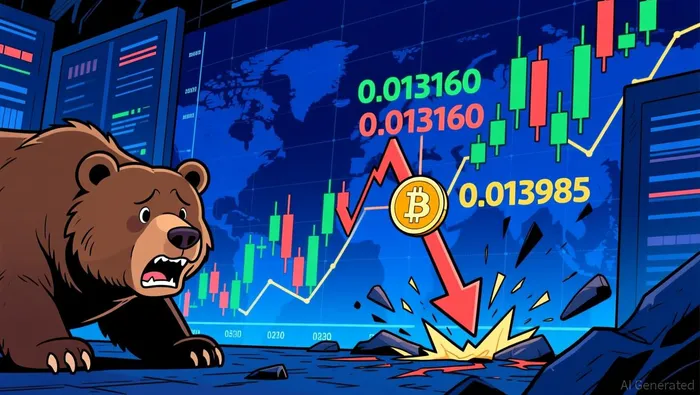
Price action over the last 24 hours demonstrates a clear struggle between buyers and sellers within a defined range. The asset recently tested the upper boundary near 0.013985 at 04:00 UTC, where a doji candlestick pattern formed, indicating indecision and a potential rejection of higher prices. This level acts as immediate resistance, further confirmed by the bearish engulfing pattern observed at 06:00 UTC, which signaled selling pressure. On the downside, support is identified around 0.013160, where a long lower shadow appeared at 12:00 UTC, suggesting buyers stepped in to defend this level. The current price of 0.013327 sits closer to the mid-range of the recent 24-hour oscillation, specifically between the 0.013160 support and the 0.013985 resistance. The presence of consecutive candles with long wicks on both sides suggests that the market is currently in a state of equilibrium, with neither side able to sustain a decisive move beyond these bounds.
Volume and Turnover vs. Historical Comparison (Derived from the OHLCV data provided)
The 24-hour total volume for XANUSDT is approximately 12.5 million USDT. When compared to the historical averages, the 15-day average daily volume is roughly 29.9 million USDT, and the 7-day average daily volume is approximately 31.4 million USDT. This indicates that the current 24-hour trading activity is significantly lower, representing less than half of the typical daily volume seen in the recent past. This low volume environment suggests a lack of strong institutional participation or broad market interest at this specific price point. Looking at intraday spikes, the hour ending at 03:00 UTC recorded a volume of 3.47 million, which is notably higher than the average single-hour volume of approximately 1.3 million derived from the 7-day data. This spike coincided with a price increase from 0.013445 to 0.013748. However, in the subsequent hours, the price failed to sustain this momentum, dipping back down to 0.013327 by 12:00 UTC. This pattern of high volume with no sustained follow-through suggests that the buying pressure during the spike was absorbed by sellers, indicating that the volume anomaly did not effectively drive a permanent price change.
Look Back: Current Market Phase (Derived from the OHLCV data)
Analyzing the market structure over the past 7 to 15 days reveals a complex picture. The data indicates a recent 7-day price increase of approximately 16.8%, which technically exceeds the 15% threshold often associated with mean reversion setups. However, the immediate price action over the last 24 hours does not show a strong, unidirectional trend but rather a consolidation. The market structure feature is classified as range-bound, with price oscillating between key support levels around 0.013160 and resistance near 0.013985. While the broader 7-day trend shows an uptrend characterized by higher highs and higher lows leading up to this point, the current phase appears to be a pause or consolidation within that larger context. The recent volatility, marked by spikes and subsequent retracements, suggests that the market is digesting the prior gains. Therefore, the current market phase is best described as a consolidation within a short-term uptrend, where the price is testing the validity of the recent gains against established resistance levels.
The market appears to be in a consolidation phase, suggesting that a breakout is likely but requires confirmation. Upside risk increases if price closes above 0.014000, while downside risk rises if support at 0.013160 is decisively broken.

Decoding market patterns and unlocking profitable trading strategies in the crypto space
Latest Articles
Stay ahead of the market.
Get curated U.S. market news, insights and key dates delivered to your inbox.


AInvest
PRO
AInvest
PRO




Comments
No comments yet