
XAN Volume Fades, Leaving Uptrend at a Crossroads
 Aime Summary
Summary
- XANUSDT trades near 0.013678 with declining hourly volume and indecisive candle patterns.
- Price remains in an uptrend phase despite recent local rejections at resistance levels.
- Volume spikes on August 4 failed to sustain momentum, suggesting weak buyer follow-through.
- Key support holds above 0.013316 while resistance tests the 0.013977 high zone.
- Caution advised as consolidation may precede a directional breakout in the next 24 hours.
Market Overview: Consolidation After Uptrend
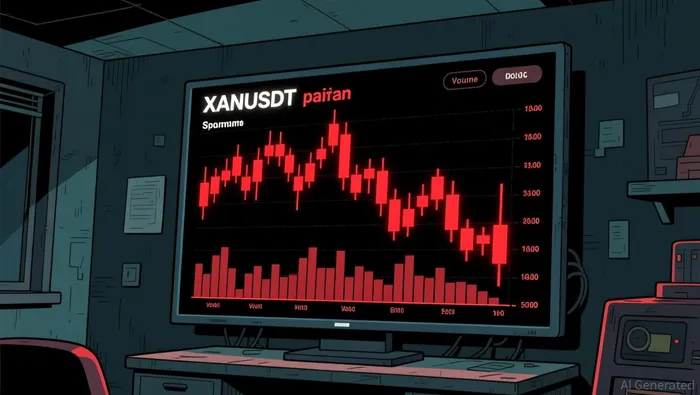
Anoma/Tether (XANUSDT) closed the latest hour at 0.013678, following a 24-hour trading session with a total volume of approximately 19.5 million tokens. The market exhibits signs of consolidation as price action struggles to break higher resistance levels.
1-Hour Support/Resistance and Candlestick Patterns
The current price of 0.013678 is positioned closer to recent resistance than immediate support, with a notable high of 0.013985 established on August 4 acting as a strong rejection zone. Support is identified around 0.013316, where multiple lower wicks have previously found buyers. Candlestick analysis reveals significant indecision, marked by a doji pattern at 00:00 on August 5 and a long upper shadow at 23:00 on August 4, which indicates that buyers failed to sustain pushes above 0.013918. The presence of these long wicks suggests that price rejections are occurring as the market approaches resistance, while the long lower shadow at 20:00 on August 4 confirms defensive buying at 0.013058. The price is currently sandwiched between these conflicting signals, hovering near the upper half of the immediate range but lacking the bullish body strength to confirm a breakout.
Volume and Turnover vs. Historical Comparison
The 24-hour total volume of roughly 19.5 million tokens is notably lower than the 7-day average daily volume of 31.48 million and the 15-day average of 28.31 million, indicating a contraction in trading interest. Specific hourly volume spikes were recorded on August 4, including a peak of 3.47 million at 03:00 and 2.26 million at 18:00, both of which exceeded typical hourly averages. However, the spike at 03:00 was followed by a decline in price over the next six hours, moving from 0.013748 down to 0.013327, demonstrating a lack of bullish follow-through. Similarly, the high volume at 18:00 saw the price recover slightly to 0.013816 but then fade into the night, closing near 0.013679 by 23:00. These instances of high volume with no sustained price advance suggest that the volume anomalies did not effectively drive the price higher, instead reflecting distribution or absorption at local tops.
Look Back: Current Market Phase
Based on the 7-day price change of 19.49% and the 3-day change of 5.53%, the market is currently in an uptrend phase characterized by higher highs and higher lows over the medium term. The market structure feature is explicitly identified as a higher high, confirming the bullish bias despite the recent consolidation. The price has not yet entered a mean reversion phase, as the prior move was significant but the current price action shows a pause rather than a sharp reversal. The market appears to be in a healthy consolidation phase within a broader uptrend, allowing for accumulation before the next potential leg up.
The next 24 hours will likely determine whether the uptrend resumes or corrects deeper. A break below 0.013316 could trigger downside risk toward 0.013058, while a decisive move above 0.013985 with volume confirmation would signal continued upside potential toward 0.014000.

Decoding market patterns and unlocking profitable trading strategies in the crypto space
Latest Articles
Stay ahead of the market.
Get curated U.S. market news, insights and key dates delivered to your inbox.


AInvest
PRO
AInvest
PRO




Comments
No comments yet