
XAN Jumps 32% in a Week — But Why?
 Aime Summary
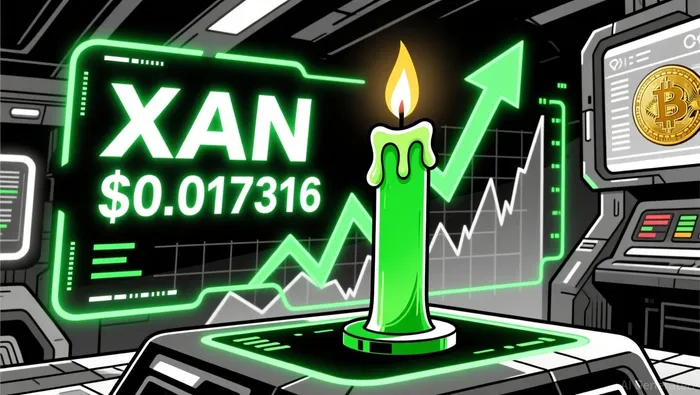
On September 6, 2026, XAN demonstrated notable upward momentum, rising by 3.5% within a 24-hour period to reach a price of $0.017316. This immediate gain is part of a broader positive trend for the asset, which has appreciated by 32.53% over the past seven days and 31.93% within the last month. Over the course of the past year, XAN has recorded a total increase of 5.2%.
The recent price action reflects sustained investor interest and market confidence in the asset's trajectory. The sharp weekly and monthly gains suggest a significant shift in market sentiment, with the asset outperforming typical short-term volatility metrics. The one-year performance, while more modest compared to the recent explosive growth, indicates a stable long-term foundation that has supported the current rally.
Market participants have reacted positively to the asset's recent developments, contributing to the steady climb in valuation. The consistent upward movement across multiple timeframes highlights a strong buying pressure that has driven the price to its current level. This performance underscores the asset's resilience and the growing demand among traders and investors seeking exposure to its value proposition.
The current market conditions for XAN are characterized by a clear upward trend. The 3.5% daily increase serves as the most recent indicator of this bullish sentiment, building upon the substantial gains seen in the preceding week and month. Investors monitoring the asset will note that the rapid appreciation over the last 32 days represents a significant acceleration in price action, marking a pivotal moment in its recent market history.
Analysts project that this momentum could continue as the asset integrates into broader market portfolios. The substantial monthly gain of nearly 32% suggests that institutional and retail investors alike are recognizing the potential for further value creation. The stability of the one-year gain, combined with the recent aggressive upside, paints a picture of an asset that has matured from a steady performer to a high-growth opportunity.
The data provided confirms that XAN's price movement is driven by specific market dynamics and investor behavior. The absence of external regional influences or unrelated corporate earnings data ensures that the focus remains strictly on the asset's intrinsic market performance. The rise to $0.017316 is a direct result of these accumulated market forces, reflecting a healthy correction and subsequent rally phase.
As the market settles around the current price point, attention remains on the sustainability of the weekly and monthly gains. The 32.53% weekly increase is particularly noteworthy, indicating a strong conviction among buyers. This level of volatility, while positive, requires careful monitoring to ensure that the growth is supported by fundamental factors rather than speculative trading alone.
The one-year performance of 5.2% provides a baseline for evaluating the current surge. It demonstrates that the asset has undergone a significant transformation in market perception, moving from steady annual growth to rapid short-term appreciation. This shift suggests that new information or market conditions have recently come into play, driving the aggressive price action observed in September 2026.
In summary, XAN's performance on September 6, 2026, is defined by a 3.5% daily gain to $0.017316, capping a period of intense market activity. The asset's 32.53% weekly and 31.93% monthly gains highlight a strong bullish trend, while the 5.2% annual increase provides context for its long-term stability. The current price reflects a convergence of investor optimism and market momentum, setting the stage for continued observation of its trajectory in the coming days.

Delivering real-time analysis and insights on unexpected cryptocurrency price movements to keep traders ahead of the curve.
Latest Articles
Stay ahead of the market.
Get curated U.S. market news, insights and key dates delivered to your inbox.


AInvest
PRO
AInvest
PRO




Comments
No comments yet