
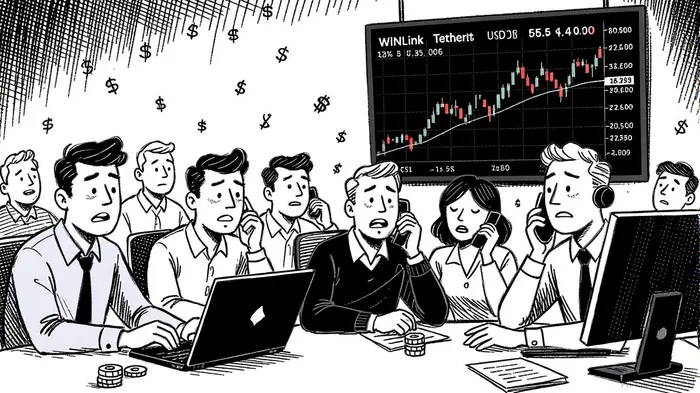
WINkLink/Tether USDt Market Overview
• • •
• Price rebounded from key support near $0.0005158, with a closing gain above $0.0005190.
• Volume spiked after 20:00 ET, confirming a breakout above the 24-hour high.
• RSI reached overbought territory, suggesting potential near-term profit-taking.
• Bollinger Bands showed a recent contraction, followed by a sharp expansion.
• MACD line crossed above signal line, signaling bullish momentum.
WINkLink/Tether USDt (WINUSDT) opened at $0.0005205 on 2025-09-05 12:00 ET and closed at $0.0005190 on 2025-09-06 12:00 ET, with a high of $0.0005266 and low of $0.0005158. Total volume was 1.44B and turnover was $758,690 during the 24-hour period.
Structure & Formations
Price showed a strong bearish correction in the early hours before a bullish reversal emerged after 19:00 ET. A strong green candle at 20:30 ET closed at $0.0005214, confirming a break above the prior day’s high. A bullish engulfing pattern at 20:30 ET and a higher high at 21:15 ET ($0.0005234) signaled a potential short-term reversal. A key support area was identified at $0.0005158–$0.0005160, where price found buying interest. A doji at 00:15 ET ($0.0005218) suggested indecision, though the following candle confirmed the bullish continuation.
Moving Averages
WINUSDT traded above the 20-period and 50-period moving averages on the 15-minute chart. The 20SMA reached $0.0005194, with the 50SMA at $0.0005183, reinforcing the short-term bullish bias. On a daily timeframe, the price remains above the 50DMA, suggesting a longer-term bullish structure. However, the 200DMA at $0.0005168 could act as dynamic support if the current rally falters.
MACD & RSI
MACD (12,26,9) crossed above the signal line at ~$0.0000000115, indicating bullish momentum. The histogram remained positive during the rally, confirming the strength of the move. RSI reached overbought territory at 67–69 during the peak hours (21:00–23:00 ET), suggesting that a near-term pullback could be due. However, RSI remains above 50, reinforcing the overall bullish tone for the next 24 hours.
Bollinger Bands
WINUSDT price remained within the BollingerBINI-- Band range for most of the session, with the bands narrowing during the 16:00–19:00 ET period, signaling a potential breakout. The expansion that followed aligned with the bullish reversal. Price currently resides near the upper band, indicating a potential overextended position. A retest of the lower band at ~$0.0005160–$0.0005165 is possible if there is profit-taking or a bearish reversal.
Volume & Turnover
Volume increased significantly during the 20:00–23:00 ET period, especially around the 20:30 ET candle, where price closed near its high. This confirmed the bullish breakout rather than a false positive. Notional turnover mirrored the volume pattern, with a peak of ~$40,000 at 20:45 ET. Divergences were not observed, and the price-volume relationship remained in alignment, supporting the validity of the breakout.
Fibonacci Retracements
The 15-minute chart showed a key swing low at $0.0005158 and a swing high at $0.0005266. The 38.2% retracement is at $0.0005210, and the 61.8% at $0.0005178—both of which were tested during the session. Price closed above the 38.2% level, suggesting a potential continuation of the bullish trend. On the daily chart, the 61.8% retracement from the recent low to high is at $0.0005173, which aligns with the 200DMA and could act as a key level for near-term consolidation.
Backtest Hypothesis
Based on the technical setup observed today—specifically the bullish engulfing pattern, the breakout above key resistance, and the strong MACD and RSI confirmation—a potential short-term trading strategy could be built around a breakout entry above the 20-period SMA with a stop loss below the 38.2% retracement level. A backtest could evaluate the strategy over the past 30 days, using a 15-minute timeframe, with entries triggered on bullish engulfing or pinocchio candles after a consolidation period. Exits would be based on the 20-period SMA and RSI overbought divergence. The hypothesis is that these signals would yield a statistically significant edge in capturing short-term bullish momentum in WINUSDT.
Decoding market patterns and unlocking profitable trading strategies in the crypto space
Latest Articles
Stay ahead of the market.
Get curated U.S. market news, insights and key dates delivered to your inbox.


Comments
No comments yet