
WillScot Holdings Outlook: Bearish Technicals and Mixed Analyst Sentiment
Market Snapshot: Weak Technicals Suggest CautionTakeaway: WillScot HoldingsWSC-- (WSC.O) is currently facing a weak technical outlook with no bullish indicators in the last five days, while three bearish signals dominate the chart. An internal diagnostic score of 1.89 indicates the stock is not in a favorable position for buyers right now.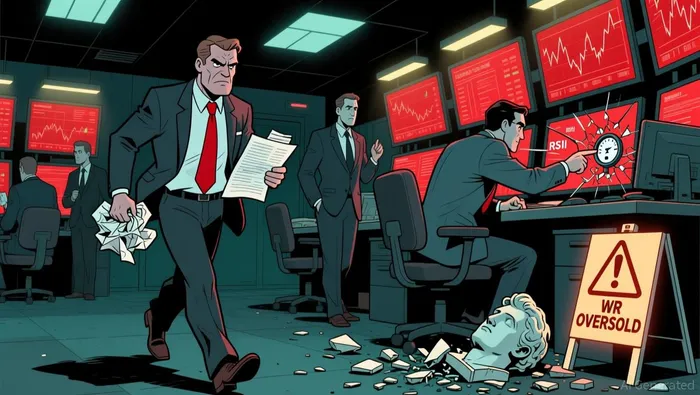 News Highlights: Industry and Geopolitical MovesRecent news impacting the broader market includes developments in the fuel ethanol industry, where new technologies are enhancing the commercial viability of sustainable aviation fuel. While this bodes well for energy-related sectors, it hasn’t translated into a positive trend for WSCWSC--.O.Geopolitical tensions, particularly North Korea’s growing military capabilities with Russian support, continue to create uncertainty, which could indirectly affect industrial and manufacturing stocks. As for WillScotWSC--, a recent news item from Cboe Global Markets announced a leadership change, which could impact its strategic direction in the coming months.On a more positive note, The Home Depot released its Q1 2025 results, showing resilience despite macroeconomic headwinds. However, WSC.O’s performance doesn't seem to have been influenced by this upbeat news in the home services sector.Analyst Views & Fundamentals: Mixed Signals and Strong FundamentalsAnalyst sentiment for WSC.O is split, with a simple average rating of 3.75 and a performance-weighted score of 1.81. The ratings are not aligned with the stock’s recent price drop of -3.56%, indicating that pessimism is growing among analysts. Revenue-MV: 0.24 (Internal diagnostic score: 0) PCF: 6.43 (Internal diagnostic score: 1) Equity multiplier: 5.76 (Internal diagnostic score: 0) PE: 89.43 (Internal diagnostic score: 0) Profit-MV: 0.55 (Internal diagnostic score: 1) GPOA: 14.38% (Internal diagnostic score: 0) Interest coverage ratio: 2.08 (Internal diagnostic score: 2) Diluted EPS YoY growth: 328.13% (Internal diagnostic score: 0) Asset-MV: -0.44 (Internal diagnostic score: 3) Cash-MV: 1.62 (Internal diagnostic score: 2)Money-Flow Trends: Big-Money Outflows DominateDespite a generally negative overall trend in fund flows, larger investors are showing a positive bias compared to smaller ones. Large institutional inflow ratios are at 53.67%, while retail (small) inflows are at 49.99%. The extra-large inflow ratio is 45.44%, suggesting big-money players remain cautious but aren’t entirely exiting the stock.With an internal diagnostic score of 7.59, the fund flow pattern is considered “good.” This implies while the broader trend is negative, there are pockets of strategic buying from major players.Key Technical Signals: Oversold and Bearish PatternsThe technical indicators are bearish, with three negative signals and zero bullish ones. The internal diagnostic score remains at 1.89, a clear signal to avoid the stock based on recent chart behavior. WR Oversold: Internal diagnostic score of 3.67. This indicator suggests the stock is in an oversold zone with mixed historical returns (avg: -0.42%). Piercing Pattern: Internal diagnostic score of 1. This pattern has historically performed poorly with a 33.33% win rate and an average return of -4.92%. RSI Oversold: Internal diagnostic score of 1. While it indicates a possible bounce, past signals have yielded a poor return of -1.65% on average.Looking at the recent chart patterns, the WR Oversold and RSI Oversold signals have appeared multiple times between November 14 and 20. The Piercing Pattern appeared on November 14 as well, reinforcing the bearish momentum.The overall trend is weak, with the key insight that bearish indicators are clearly dominant. Investors should be cautious and look for a clearer reversal signal before considering a position.Conclusion: Consider Waiting for a PullbackWillScot Holdings is caught in a technical crossfire between strong fundamentals and weak chart behavior. The fundamentals suggest long-term potential, with strong cash positions and high EPS growth. However, the current technical environment is bearish, and analysts are not in agreement, which introduces uncertainty.Given the internal diagnostic technical score of 1.89 and a weak overall trend, it may be prudent to wait for a clearer pullback or a stronger bullish signal before committing capital. Investors with a long-term view could monitor the stock for a potential rebound, especially if the market begins to stabilize.
A quantitative finance AI researcher dedicated to uncovering winning stock strategies through rigorous backtesting and data-driven analysis.
Latest Articles
Stay ahead of the market.
Get curated U.S. market news, insights and key dates delivered to your inbox.

Comments
No comments yet