
Wells Fargo Crushes Q3 Targets as Credit Costs Ease and Consumer Strength Powers a 3% Stock Surge


Wells Fargo turned in a clean Q3 beat and the stock is responding, up roughly 3% as investors weigh solid execution against a still-mixed rate backdrop. EPS of $1.66 topped the $1.53–$1.55 consensus range on revenue of $21.44 billion versus $21.1–$21.16 billion expected, with fee growth and stable credit doing just enough to offset mild margin compression. CEO Charlie Scharf called out “broad-based growth across both our consumer and commercial businesses,” framing Wells as “a different company than five years ago” with improving efficiency and risk controls. The question from here is whether steady—but not spectacular—NII and a disciplined credit profile can sustain momentum into year-end.
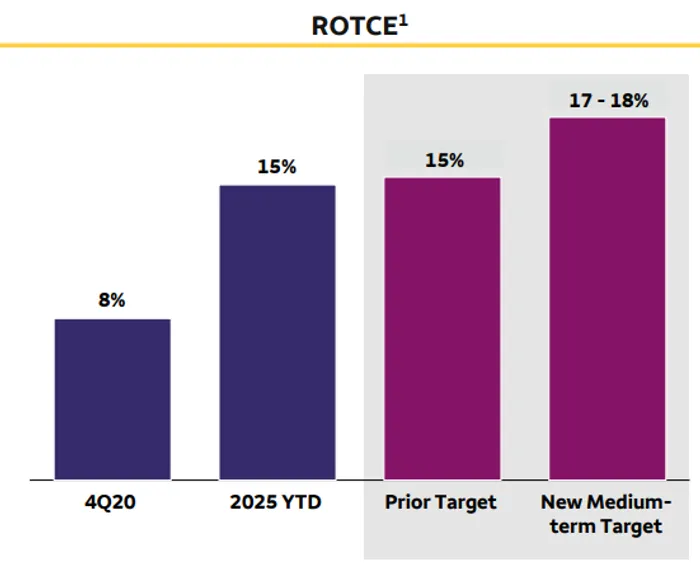
Against expectations, the mix was constructive. Net interest income of $11.95 billion was fractionally below the $12.01 billion estimate, but noninterest income rose 9% year over year to $9.49 billion, lifting the top line above consensus. Return on equity registered 12.8% and management reiterated a medium-term 17–18% ROTCE target as efficiency gains, capital optimization, and reinvestment continue. Importantly for near-term modeling, Wells guided Q4 NII to $12.4–$12.5 billion and said full-year 2025 NII should be roughly in line with 2024’s $47.7 billion—steady, not heroic, but credible given deposit mix and rate path assumptions.
Margins nudged lower but remain orderly. Net interest margin printed 2.61%, down from 2.68% in Q2, reflecting higher funding costs and some ongoing deposit remixing. On the asset side, fixed-rate repricing, modest loan growth, and investment securities balances helped, but liability costs and competitive dynamics—especially in consumer autos—kept pressure on spread. The expense side was manageable: noninterest expense rose 6% to $13.85 billion on severance, performance comp, tech spend, and advertising; Q4 noninterest expense is guided to about $13.5 billion. Management’s full-year expense outlook ticked up modestly to roughly $54.6 billion, largely tied to talent and market-driven compensation, particularly in Wealth and Investment Management.
Credit was a clear positive swing factor. Provision for credit losses fell to $681 million from $1.01 billion in Q2 and $1.07 billion a year ago, including a $273 million reserve release as asset quality improved and office CRE exposure continued to shrink. Net charge-offs declined 14% year over year to $954 million, or 0.40% of average loans (down from 0.49%), with consumer losses easing and commercial losses stable around the high-teens basis-point range. The allowance for credit losses moved down to $14.3 billion (1.52% of loans). Scharf’s read-through: “credit performance was strong and continued to improve,” even as he acknowledged “some economic uncertainty remains.”
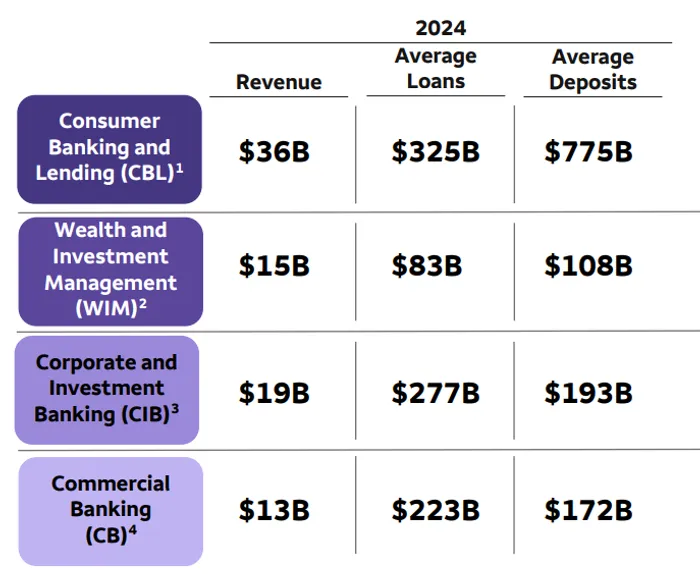
By business, the consumer engine did the heavy lifting. Consumer Banking and Lending delivered $9.65 billion in revenue (+6% y/y) and $2.19 billion of net income (+14% y/y). Card was the standout—revenue up 13% on higher revolving balances and fee growth—while home lending rose 3% on better mortgage banking and servicing-rights marks. The headwind remains auto: margin compression and elevated used-vehicle loss severities pressured results and kept underwriting tight. Engagement metrics continue to trend well, with active mobile users up and new card accounts accelerating, a healthy signal for forward fee income.
Corporate and Investment Banking was mixed but net supportive. Markets revenue increased 6% year over year to $1.85 billion, with Equities up 14% and FICC up 2%; rates was the soft spot while commodities/FX/credit products were firmer. Investment banking fees jumped 25–32% year over year on better M&A and underwriting conditions, and average loans and deposits in the segment both grew mid-single digits—evidence of expanding client wallet. Commercial Banking lagged on revenue (−9% y/y) as lower rates and deposit migration clipped NII, though management flagged solid middle-market loan demand and better expense discipline. Wealth and Investment Management was a bright spot, with revenue up 8%, NII up 16% on higher balances and lower deposit costs, and client assets at $2.47 trillion (+8%), highlighting the franchise’s affluent skew and operating leverage to higher markets.
Capital and liquidity stayed comfortably above regulatory floors while supporting stepped-up shareholder returns. CET1 ended at 11.0% and LCR at 121%. Wells repurchased $6.1 billion of stock and lifted the dividend to $0.45, consistent with the plan to manage CET1 toward 10–10.5% over time as remediation spend fades and revenue mix improves. Average loans grew 2% year over year to $929 billion, deposits held at $1.34 trillion, and the balance sheet closed near $2.0 trillion in assets.
Looking ahead, the outlook is pragmatic. Q4 NII at $12.4–$12.5 billion triangulates with the “flat vs. 2024” NII guide for 2025; the message is stability over stretch. Expense normalization is still a work in progress—headcount actions and tech spend are running through—but efficiency initiatives and mix shift toward fee businesses should preserve operating leverage if markets stay cooperative. Scharf’s tone was constructive but grounded: the U.S. consumer “remains strong,” the economy “has been resilient,” and Wells will lean into growth in cards, wealth, and corporate banking now that legacy constraints are receding.
Key areas to monitor into year-end: the trajectory of NIM versus deposit costs as rate cuts inch closer; auto credit and pricing discipline as competitive pressure persists; office-linked CRE loss content as reserves come down; and fee durability in WIM and CIB if volatility ebbs. For today, the print checks the boxes—beat on EPS and revenue, better-than-feared credit, and a steady guide—and the 3% pop suggests investors are rewarding consistency while they wait for a clearer catalyst on margin expansion. In bank-land, boring and predictable can be a premium product; Wells’ Q3 fits that brief.
Senior Analyst and trader with 20+ years experience with in-depth market coverage, economic trends, industry research, stock analysis, and investment ideas.
Latest Articles
Stay ahead of the market.
Get curated U.S. market news, insights and key dates delivered to your inbox.
AInvest
PRO
AInvest
PRO
Comments
No comments yet