
Wayfair (W) Surges 30% on Q2 Beat: Can The Breakout Hold Above $108?
 Aime Summary
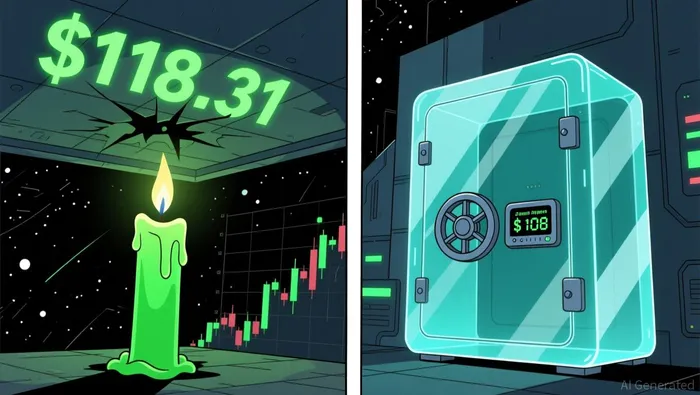
Wayfair (W) surged nearly 30% on August 5, 2026, after the company reported second-quarter results that beat analyst estimates on both revenue and earnings. The stock gapped above its 20-day and 50-day moving averages and closed near its 3-month high, bringing the key technical question into focus: can the post-earnings momentum sustain above the $108 support zone, or will the gap fill over the coming sessions?
Why This Setup Matters Now
W appeared on the Yahoo Finance day gainers screener with a 29.97% surge, driven by the Q2 earnings beat reported after the close on August 4. The company posted revenue of $3.52 billion (up 7.5% YoY) and adjusted EPS of $0.95, surpassing the consensus estimate of $0.87, as reported by Investing.com. Free cash flow of $301 million was the strongest since 2020, according to Morningstar. Truist Financial raised its price target to $135 from $99 following the results, per FinancialModelingPrep.
Table 1: Market Snapshot
| Metric | Value |
|---|---|
| Symbol | W (NYSE) |
| Close | $116.08 |
| Change | +$21.54 (+29.97%) |
| Previous Close | $94.54 |
| Today's Range | $108.00 - $118.31 |
| 3-Month Range | $55.60 - $118.31 |
| Volume | 13.5M (2.6x avg) |
| Source | Yahoo Finance |
Quick Read
Table 2: Quick Read
| Question | Signal |
|---|---|
| What moved the stock? | Q2 earnings beat + raised outlook |
| How far from 3-month high? | $118.31 vs $116.08 close (2% away) |
| Is the gap filled? | Gap from $94.54 to $108.00 remains open |
| Volume credible? | 2.6x average -- above average conviction |
Technical Bias
Table 3: Technical Bias
| Indicator | Reading | Bias |
|---|---|---|
| Price vs MA20 | +29.3% above | Bullish |
| Price vs MA50 | +37.5% above | Bullish |
| RSI (14) | 62.5 | Neutral-bullish |
| Volume vs 10d avg | 2.6x | Bullish |
| Near 3-month high | $118.31 (2% away) | Bullish |
The stock is extended above its moving averages after a single-day gap, which introduces mean-reversion risk. The RSI at 62.5 is elevated but not yet in overbought territory above 70, leaving room for further upside.
Key Levels To Watch
Table 4: Key Levels
| Level | Price | Type |
|---|---|---|
| R2 | $118.31 | 3-month high (today's high) |
| R1 | $117.42 | Analyst target reaction zone |
| Close | $116.08 | Current |
| S1 | $108.00 | Today's low / gap support |
| S2 | $95.00 | Approximate pre-gap close zone |
| S3 | $89.79 | 20-day MA |
Levels are derived from today's price action and moving averages, not confirmed historical support or resistance.
Scenario Map
Table 5: Scenario Map
| Scenario | Trigger | Target |
|---|---|---|
| Bullish extension | Hold above $108, clear $118.31 | Retest $135 (Truist target) |
| Mean reversion | Gap fill below $108 | Revisit $95 area |
| Breakdown | Lose $95 | Test $89.79 (20-day MA) |
Momentum And Volume Check
Volume surged to 13.5 million shares, approximately 2.6 times the 10-day average of 5.2 million, according to Yahoo Finance. This confirms institutional participation in the move. The RSI at 62.5 leaves room for further upside before reaching overbought levels, but the stock is now extended from its moving averages, making a consolidation or pullback phase likely in the near term.
Table 6: Momentum Check
| Metric | Value |
|---|---|
| Today's Volume | 13.5M |
| 10-Day Avg Volume | 5.2M |
| Volume Ratio | 2.6x |
| RSI (14) | 62.5 |
| Distance to 20-day MA | +29.3% |
What Would Change The View
Table 7: View Change Checklist
| Condition | Impact |
|---|---|
| Close below $108 | Weakens the breakout |
| Volume dries up below avg | Lowers conviction |
| Close above $118.31 | Confirms breakout continuation |
| Analyst downgrades or profit warning | Bearish catalyst |
Bottom Line
Bottom line: W remains bullish as long as it holds above $108. A move above $118.31 would strengthen the setup and open the path toward the $135 analyst target, while a break below $108 would signal a gap-fill back toward the pre-earnings $95 zone.
Summary
- W surged 30% after reporting Q2 2026 earnings that beat on revenue and EPS.
- Volume at 2.6x average confirms institutional participation in the move.
- The stock is extended above its moving averages, introducing mean-reversion risk.
- Key support at $108 (today's low) must hold to keep the bullish setup intact.
- A close above the 3-month high of $118.31 would confirm the continuation.
Disclaimer
This article is for informational purposes only and does not constitute financial advice. Technical indicators can help frame risk and momentum, but they do not guarantee future price movement.

Stay ahead of the market.
Get curated U.S. market news, insights and key dates delivered to your inbox.


AInvest
PRO
AInvest
PRO




Comments
No comments yet