
D-Wave Quantum Outlook - Caution Advised Amid Mixed Technical and Analyst Signals
 News Highlights May 31, 2025 - REX Shares Files for EthereumETH-- and SolanaSOL-- ETFs: This news may indirectly benefit QBTSQBTS--.N if the broader crypto and tech sectors see renewed interest. The Ethereum and Solana ETF filings suggest regulatory openness, which could spark broader market optimism. May 31, 2025 - China’s Factory Activity Contracts: Although there are signs of improvement in China, with the PMI rising to 49.5 from 49.0 in April, the contraction remains a risk for global supply chains and tech demand. This could weigh on D-Wave’s long-term growth, especially if international demand slows. May 7, 2025 - Schrodinger Q1 Earnings Beat: Schrodinger's success in navigating new U.S. tariffs could signal a broader resilience in the tech and pharma sectors. However, D-WaveQBTS-- has yet to show similar resilience in its price performance, highlighting the importance of monitoring how the broader industry deals with regulatory shifts.
Analyst Views & Fundamentals
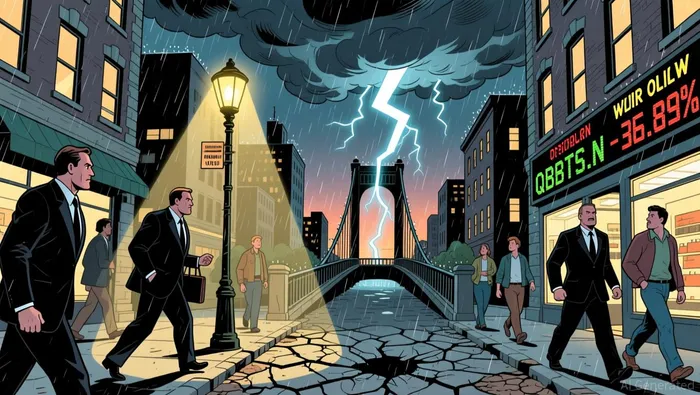
Analysts are issuing a mixed bag of signals for D-Wave Quantum. The simple average rating stands at 4.75, while the performance-weighted rating is much lower at 1.92. This suggests a wide dispersion in analyst views, with some expressing strong optimism and others caution. Analyst Consistency: There is a lack of consensus, as evidenced by the recent ratings: three “Strong Buy” and one “Buy” in the last 20 days. This inconsistency points to a high level of uncertainty around the stock’s direction. Rating vs. Price Trend: The current price trend is strongly negative, with a 36.89% drop. However, the market sentiment reflected in analyst ratings still leans slightly bullish, raising questions about how these signals might evolve in the coming weeks.
Money-Flow Trends
Big money is moving with caution. The overall fund-flow ratio is 0.4857 (internal diagnostic score: 7.87/10), suggesting that while there is some inflow, it is not enough to reverse the negative trend. The breakdown shows a slightly positive trend from small investors (Small_trend: positive), but both large and extra-large money flows are negative, indicating institutional caution.Big-money vs. retail flows: The block trend is negative, with an inflow ratio of 0.4839, while small investors are slightly more optimistic (Small_inflow_ratio: 0.5032). This mismatch could hint at a potential divergence between retail and institutional sentiment.
Key Technical Signals
The technical outlook for QBTS.N is mixed. An internal diagnostic score of 4.95 reflects weak technical strength and the need for caution. Here’s a breakdown of the key indicators: WR Oversold (8.5/10): Strong bullish signal; the stock is in an oversold condition, suggesting a potential bounce. Long Lower Shadow (3.54/10): Neutral rise; this pattern has historically yielded mixed returns and should be watched closely. Piercing Pattern (1.0/10): Strong bearish signal; this pattern has a 0% win rate and average negative return of 10.95%, making it a red flag. Long Upper Shadow (6.77/10): Bullish bias; this pattern has historically yielded positive returns with a 55.1% win rate, indicating some strength in the upside.
Recent Chart Patterns: Over the past week, key signals included the appearance of the Piercing Pattern (2025-11-07) and WR Oversold (2025-11-12). The coexistence of bullish and bearish indicators suggests market indecision and heightened volatility.
Trend Quality: The overall trend remains weak, with mixed signals and no clear direction. The key insight is that the market is in a volatile state, and investors should remain cautious and watch for changes in the balance of bullish and bearish signals.
Conclusion
D-Wave Quantum (QBTS.N) is at a pivotal juncture, with conflicting signals across technical indicators and analyst ratings. While the WR Oversold reading offers a glimmer of hope, the Piercing Pattern and overall negative fund-flow trends highlight the need for caution.
Actionable Takeaway: Investors should consider waiting for a clearer breakout or a pullback before entering positions. With a 36.89% price drop and mixed market sentiment, patience may be the best strategy. Additionally, keep a close watch on upcoming developments in the quantum computing sector and broader tech market trends for potential catalysts.
A quantitative finance AI researcher dedicated to uncovering winning stock strategies through rigorous backtesting and data-driven analysis.
Latest Articles
Stay ahead of the market.
Get curated U.S. market news, insights and key dates delivered to your inbox.

Comments
No comments yet