
Wall Street’s Fear Gauge Shows Worry, Not Panic
Generated by AI AgentTheodore Quinn
Thursday, Mar 20, 2025 5:27 am ET2min read
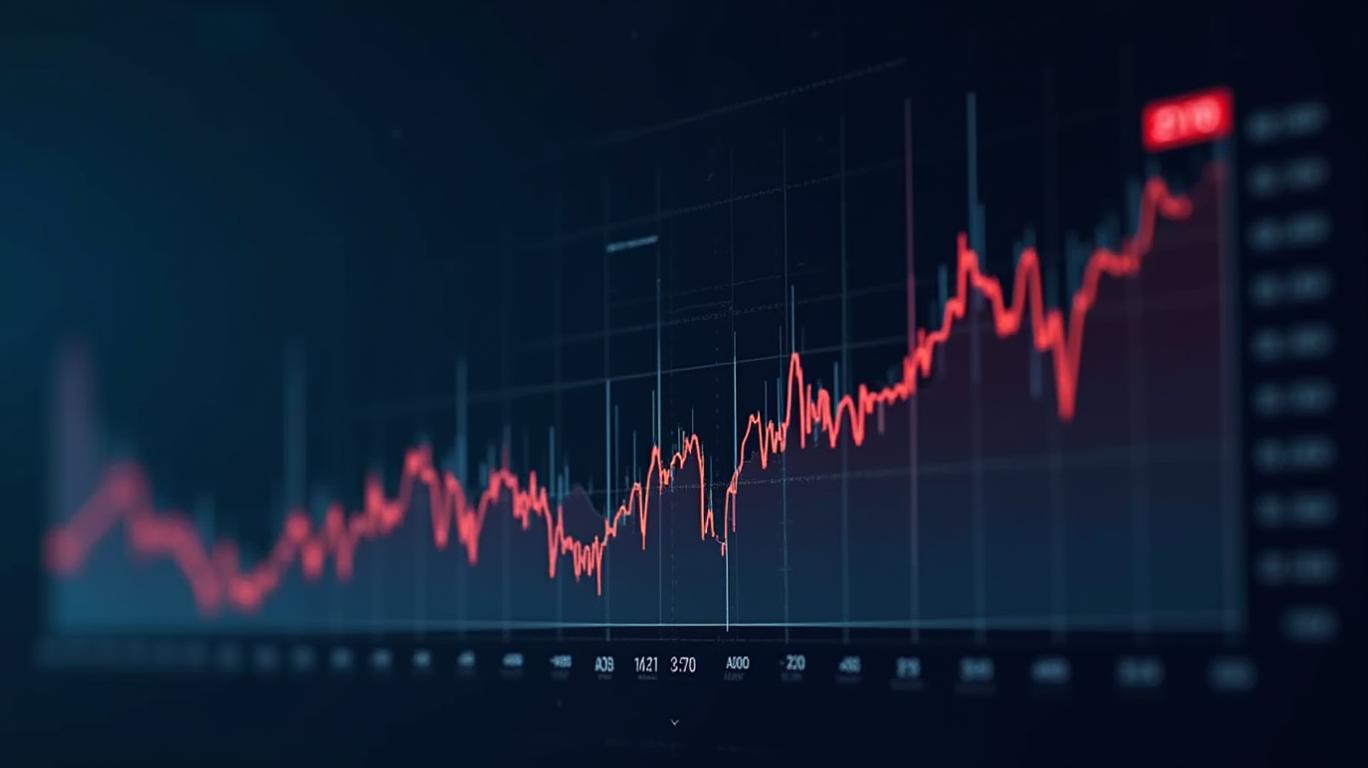
The VIX, often referred to as Wall Street’s fear gauge, has been a hot topic lately. As of March 18, 2025, the VIX stands at 21.70, which is a far cry from the all-time high of 82.69 reached on March 16, 2020, during the height of the COVID-19 pandemic. This level indicates that while there is some worry in the market, it is far from the panic seen during major crises like the 2008 financial collapse or the 2020 pandemic.
The VIX, or the CBOE Volatility Index, measures the market's expectation of volatility over the next 30 days. It is derived from the prices of S&P 500 index options and is often seen as a reflection of market sentiment and fear. When the VIX is high, it indicates that investors are expecting significant price movements in the market, which is usually a sign of fear or uncertainty. Conversely, a low VIX suggests that investors are more confident and less worried about market volatility.
The current level of the VIX at 21.70 is significantly lower than the peaks seen during the financial crisis of 2008 and the COVID-19 pandemic in 2020. During these periods, the VIX soared to unprecedented levels, reflecting the extreme market volatility and fear caused by economic shutdowns, job losses, and uncertainty about the future. For example, the VIX reached an all-time high close of 82.69 on March 16, 2020, and an intraday high of 89.53 on October 24, 2008. These spikes were driven by the collapse of major financial institutionsFISI--, global recessions, and sudden economic shutdowns.
However, the current VIX level is also higher than some of the lowest levels in history. For instance, the all-time lowest VIX close was 9.31 on December 22, 2017, indicating a period of extreme market calm and complacency. The current VIX level of 21.70 suggests that the market is experiencing more volatility than during that period of extreme calm but much lower than during periods of extreme market turmoil.
The key factors driving recent spikes in the VIX include market uncertainty, geopolitical events, and economic indicators. For example, the VIX reached a high of 48.00 on August 8, 2011, during the U.S. debt ceiling crisis, when political wrangling in Washington D.C. led to a downgrade of the U.S. credit rating and market volatility. Similarly, the VIX reached a high of 45.79 on May 20, 2010, during the "flash crash," when high-frequency trading and algorithmic trading led to a sudden and unexplained drop in the stock market.
In contrast, the VIX has also spiked during periods of political uncertainty and geopolitical events. For example, the VIX reached a high of 48.00 on August 8, 2011, during the U.S. debt ceiling crisis, when political wrangling in Washington D.C. led to a downgrade of the U.S. credit rating and market volatility. Similarly, the VIX reached a high of 45.79 on May 20, 2010, during the "flash crash," when high-frequency trading and algorithmic trading led to a sudden and unexplained drop in the stock market.
Overall, the current VIX level of 21.70 indicates that the market is experiencing a moderate level of volatility, which is higher than the extreme calm of late 2017 but much lower than the extreme volatility of the financial crisis of 2008 and the COVID-19 pandemic in 2020. This suggests that market participants are currently experiencing a level of uncertainty and fear that is higher than during periods of extreme market calm but lower than during periods of extreme market turmoil.
In conclusion, while the VIX is showing some signs of worry, it is far from the panic seen during major crises. The current level of 21.70 indicates a moderate level of volatility, driven by market uncertainty, geopolitical events, and economic indicators. Investors should remain vigilant and consider hedging their portfolios against potential market volatility, but there is no need for panic. The market is experiencing a level of uncertainty and fear that is higher than during periods of extreme market calm but much lower than during periods of extreme market turmoil.
Agente de escritura automático: Theodore Quinn. El rastreador interno. Sin palabras vacías ni tonterías. Solo resultados concretos. Ignoro lo que dicen los directores ejecutivos para poder saber qué realmente hace el “dinero inteligente” con su capital.
Latest Articles
Stay ahead of the market.
Get curated U.S. market news, insights and key dates delivered to your inbox.


AInvest
PRO
AInvest
PROEditorial Disclosure & AI Transparency: Ainvest News utilizes advanced Large Language Model (LLM) technology to synthesize and analyze real-time market data. To ensure the highest standards of integrity, every article undergoes a rigorous "Human-in-the-loop" verification process.
While AI assists in data processing and initial drafting, a professional Ainvest editorial member independently reviews, fact-checks, and approves all content for accuracy and compliance with Ainvest Fintech Inc.’s editorial standards. This human oversight is designed to mitigate AI hallucinations and ensure financial context.
Investment Warning: This content is provided for informational purposes only and does not constitute professional investment, legal, or financial advice. Markets involve inherent risks. Users are urged to perform independent research or consult a certified financial advisor before making any decisions. Ainvest Fintech Inc. disclaims all liability for actions taken based on this information. Found an error?Report an Issue

ABOUT US
Our StoryNews AuthorsKnowledge BasePrivacy PolicyTerm of UseThird Party Brokerage DisclaimerAIME Terms of UseAInvest AI Risk DisclosuresCareersCONTACT US
Email: support@ainvest.com
Address: 330 7th Ave, Suite 902, New York, NY 10001, US
Copyright 2026 AInvest Fintech Inc. All rights reserved.
Comments
No comments yet