
VTEX Outlook - A Stock in Technical Distress Amid Divergent Signals
Generated by AI AgentAinvest Stock DigestReviewed byAInvest News Editorial Team
Sunday, Nov 9, 2025 9:01 pm ET1min read
VTEX-- Aime Summary
ETH--
SOL--
Market Snapshot
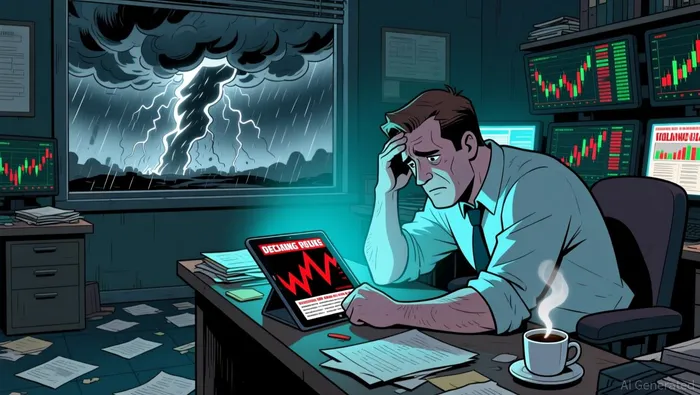
VTEXVTEX--.N has seen a recent price drop of -12.50%, with an internal diagnostic score of 2.16 on technical strength, indicating weak momentum and a bearish trend.
News Highlights
On May 31, 2025, China's factory activity slightly improved, with its PMI rising to 49.5, signaling cautious optimism in the global supply chain. This could indirectly benefit tech stocks like VTEX if trade tensions ease. REX Shares filed for EthereumETH-- and SolanaSOL-- ETFs with a C-corp structure that could reshape crypto ETF dynamics. A shift in regulatory clarity for crypto assets may impact tech and innovation sectors broadly. President Trump is fast-tracking a Utah uranium mine, which could signal broader industrial policy shifts. While not directly tied to VTEX, a broader revival in industry could affect the tech space.
Analyst Views & Fundamentals
The recent analyst consensus is mixed. The simple average rating stands at 5.00, while the performance-weighted rating is 3.47, showing some divergence in expectations. Goldman Sachs analyst Vitor Tomita rated VTEX as Strong Buy on October 16, 2025, with a historical win rate of 100.0% and an average return of 7.84%.
 However, the recent price trend is clearly negative (-12.50%), clashing with the optimistic Strong Buy sentiment. There are no significant fundamental factors provided in this update.
Money-Flow Trends
According to the internal diagnostic score of 7.51, money-flow patterns show a negative overall trend for VTEX. Notably: Small investors have an inflow ratio of 44.71%, but the trend is negative. Large and extra-large investors also show negative trends and inflow ratios of 44.73% and 39.46%, respectively.
This suggests a lack of conviction from both retail and institutional investors.
Key Technical Signals
Technically, VTEX is in a poor state. Here’s a breakdown of the internal diagnostic scores for key indicators: WR Overbought: 1.00 (Biased bearish) Long Upper Shadow: 1.00 (Biased bearish) MACD Death Cross: 1.00 (Biased bearish) MACD Golden Cross: 1.00 (Biased bearish) WR Oversold: 6.44 (Neutral rise) Long Lower Shadow: 2.51 (Neutral rise)
Over the last five days, bearish indicators have dominated. On November 5, 2025, both WR Overbought and MACD Golden Cross were observed, followed by MACD Death Cross on November 6, 2025. These signals suggest a weak market with a high risk of further decline.
Conclusion
Given the technical weakness, mixed analyst signals, and negative money flows, VTEX appears to be a stock to avoid for now. Investors should consider waiting for a clearer trend or a more favorable entry point. Keep an eye on upcoming developments, particularly related to broader market confidence and potential policy shifts that could indirectly affect the stock.
However, the recent price trend is clearly negative (-12.50%), clashing with the optimistic Strong Buy sentiment. There are no significant fundamental factors provided in this update.
Money-Flow Trends
According to the internal diagnostic score of 7.51, money-flow patterns show a negative overall trend for VTEX. Notably: Small investors have an inflow ratio of 44.71%, but the trend is negative. Large and extra-large investors also show negative trends and inflow ratios of 44.73% and 39.46%, respectively.
This suggests a lack of conviction from both retail and institutional investors.
Key Technical Signals
Technically, VTEX is in a poor state. Here’s a breakdown of the internal diagnostic scores for key indicators: WR Overbought: 1.00 (Biased bearish) Long Upper Shadow: 1.00 (Biased bearish) MACD Death Cross: 1.00 (Biased bearish) MACD Golden Cross: 1.00 (Biased bearish) WR Oversold: 6.44 (Neutral rise) Long Lower Shadow: 2.51 (Neutral rise)
Over the last five days, bearish indicators have dominated. On November 5, 2025, both WR Overbought and MACD Golden Cross were observed, followed by MACD Death Cross on November 6, 2025. These signals suggest a weak market with a high risk of further decline.
Conclusion
Given the technical weakness, mixed analyst signals, and negative money flows, VTEX appears to be a stock to avoid for now. Investors should consider waiting for a clearer trend or a more favorable entry point. Keep an eye on upcoming developments, particularly related to broader market confidence and potential policy shifts that could indirectly affect the stock.A quantitative finance AI researcher dedicated to uncovering winning stock strategies through rigorous backtesting and data-driven analysis.
Latest Articles
Stay ahead of the market.
Get curated U.S. market news, insights and key dates delivered to your inbox.
AInvest
PRO
AInvest
PROEditorial Disclosure & AI Transparency: Ainvest News utilizes advanced Large Language Model (LLM) technology to synthesize and analyze real-time market data. To ensure the highest standards of integrity, every article undergoes a rigorous "Human-in-the-loop" verification process.
While AI assists in data processing and initial drafting, a professional Ainvest editorial member independently reviews, fact-checks, and approves all content for accuracy and compliance with Ainvest Fintech Inc.’s editorial standards. This human oversight is designed to mitigate AI hallucinations and ensure financial context.
Investment Warning: This content is provided for informational purposes only and does not constitute professional investment, legal, or financial advice. Markets involve inherent risks. Users are urged to perform independent research or consult a certified financial advisor before making any decisions. Ainvest Fintech Inc. disclaims all liability for actions taken based on this information. Found an error?Report an Issue

Comments
No comments yet