
Vistra Plunges 6.46%: A Violent Shakeout in Independent Power Sector Signals Deep Technical Breakdown
 Aime Summary
Summary
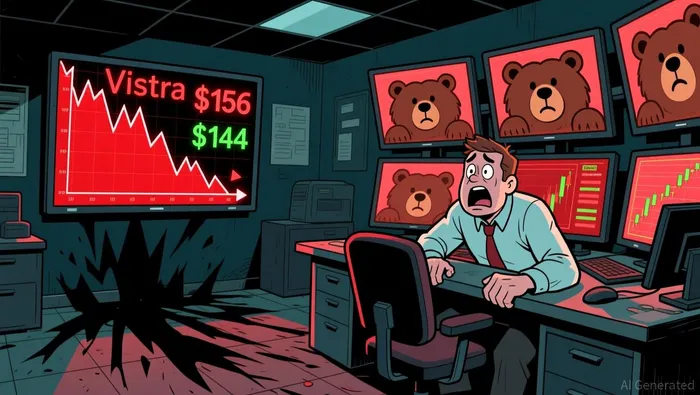
• VistraVST-- (VST) shares plummeted 6.46% to close at $145.86, erasing significant intraday gains.

• The stock traded in a wide range, hitting an intraday high of $156.85 before crashing to a low of $144.50.
• Technical indicators flash bearish warnings with MACD histogram at -1.14 and RSI cooling to 48.12.
• Options market shows heavy put activity, with the $140 put seeing 174 contracts traded and a 161% surge in price change.
Bearish Sentiment Overwhelms Energy Sector Momentum
Vistra experienced a severe intraday reversal, shedding over $10 per share as selling pressure intensified after the opening hours. Despite starting near the previous close of $155.94, the stock failed to sustain momentum above the $156 resistance, eventually breaking below key moving averages. The sharp decline to $144.50 reflects a loss of buyer confidence and a technical breakdown that has triggered algorithmic selling. Although no specific company-level negative news was reported in the provided feed, the sector-wide news highlights broader energy industry dynamics, such as Unison Energy’s microgrid deals and OPTERRA’s acquisitions, which have not provided sufficient tailwinds to support Vistra’s valuation at current levels. The absence of positive catalysts combined with weak technical structure has allowed sellers to dominate the session.
Independent Power Sector Weakness Mirrors Vistra’s Decline
The Independent Power and Renewable Electricity Producers sector appears to be under pressure, with sector leader NextEra Energy (NEE) also posting a modest decline of -0.29%. While NEE’s drop is less severe, the broader sector lacks the bullish momentum typically required to prop up higher-beta names like Vistra. The sector news, featuring deals from Unison Energy, HF Sinclair, and OPTERRA, indicates consolidation and strategic expansion rather than explosive growth, failing to generate the enthusiasm needed to counteract Vistra’s technical weakness. This divergence suggests that Vistra’s drop is not merely a sector-wide issue but reflects specific vulnerability in the stock’s position relative to peers.
Technical Breakdown Dictates Bearish Options Strategy
The technical picture for Vistra is decidedly bearish, with the stock trading below its 30-day, 100-day, and 200-day moving averages. The MACD histogram is deeply negative at -1.14, indicating strong downward momentum, while the RSI at 48.12 suggests the stock is losing bullish strength but is not yet oversold. Bollinger Bands show the price has breached the lower band of $143.89, signaling extreme volatility and potential for further downside. Support levels are currently weak, with the 200-day support zone at $157.55–$159.07 now acting as distant resistance.
Based on the options chain, we identify two contracts that offer high leverage and strong short-term characteristics for traders betting on continued weakness or hedging positions:
• VST20260807P140VST20260807P140--: Put Option, Strike $140, Expiration 2026-08-07. IV: 87.25% (High implied volatility indicates expensive premium but high sensitivity), Leverage: 56.09% (High leverage amplifies returns), Delta: -0.29 (Moderate price sensitivity), Theta: -0.10 (Significant time decay), Gamma: 0.026 (High sensitivity to price changes), Turnover: $39,741 (Good liquidity). This contract stands out for its high leverage and liquidity, making it ideal for short-term bearish bets.
• VST20260807P143VST20260807P143--: Put Option, Strike $143, Expiration 2026-08-07. IV: 84.32% (High implied volatility), Leverage: 41.24% (Moderate-high leverage), Delta: -0.38 (Higher price sensitivity), Theta: -0.00 (Minimal time decay), Gamma: 0.029 (High sensitivity to price changes), Turnover: $45,936 (Highest liquidity among puts). This contract offers the highest liquidity and minimal time decay, providing a more stable entry for traders seeking exposure to downside moves without rapid theta erosion.
Options Payoff Calculation Primer: For this payoff estimation, we assume a 5% downside scenario from current price ($145.86) where ST = $138.57. For VST20260807P140, Payoff = max(0, 138.57 - 140) = 0 (Out of the money). For VST20260807P143, Payoff = max(0, 138.57 - 143) = 0 (Out of the money). While both puts are out of the money in this specific 5% scenario, their high gamma and leverage offer significant upside if the decline accelerates beyond 5%.
If $144.50 breaks, VST20260807P143 offers high liquidity and low theta decay for aggressive short-side potential.
Maintain Caution: Watch for $144 Breakdown and Sector Leadership
The current move in Vistra appears to be a technical breakdown rather than a fundamental shift, but the bearish momentum is strong. Investors should watch for a sustained break below $144.50, which could open the door to further declines toward the 52-week low of $132.66. The lack of positive news and the sector leader NextEra Energy’s (NEE) modest decline of -0.29% suggest that broader support is lacking. Action-oriented insight: Watch for $144 breakdown or a bounce above $156 to confirm trend reversal; until then, bearish options strategies offer asymmetric risk-reward.

TickerSnipe provides professional intraday stock analysis using technical tools to help you understand market trends and seize short-term trading opportunities.
Latest Articles
Stay ahead of the market.
Get curated U.S. market news, insights and key dates delivered to your inbox.


AInvest
PRO
AInvest
PRO




Comments
No comments yet