
Vistra Ignites with 4.1% Surge: A Power Play Amidst Record-Breaking Heat
 Aime Summary
Summary
• VistraVST-- (VST) closes intraday session at $154.30, marking a robust 4.12% gain from the previous close of $148.19.

• The stock traded within a volatile intraday range, hitting a high of $155.285 and a low of $146.19, reflecting intense battle between buyers and sellers.
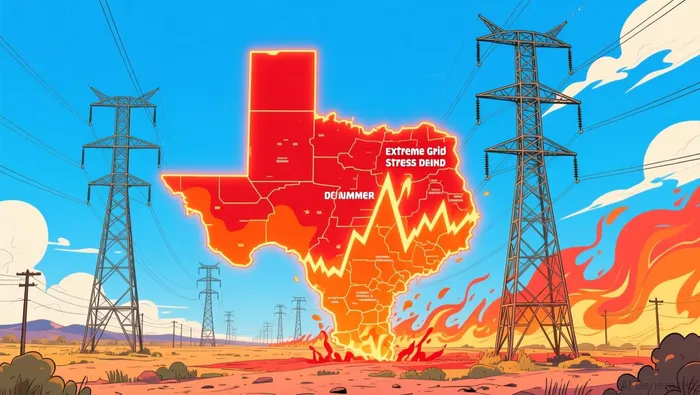
• ERCOT recorded a historic hourly peak load of 91.1 GW on July 22, driven by severe heat waves that continue to strain the Texas grid.
• Trading volume reached 1,824,516 shares with a turnover rate of 0.55%, indicating moderate but significant institutional and retail interest.
Vistra Energy’s sharp intraday rally is not merely a technical bounce but a fundamental response to the intensifying energy crisis in Texas. As record-breaking temperatures push grid demand to unprecedented levels, independent power producers like VSTVST-- are positioned to capitalize on the scarcity and necessity of reliable generation. The stock’s ability to reclaim the $154 level amidst broader sector weakness suggests a strong, specific catalyst at play.
ERCOT Record Load Drives Independent Power Valuation
The primary catalyst for Vistra’s 4.12% surge is the critical strain on the Texas power grid, specifically within the Electric Reliability Council of Texas (ERCOT). Data from the U.S. Energy Information Administration reveals that ERCOT hit a record hourly peak load of 91.1 gigawatts (GW) on July 22, 2026. This figure represents a 6% increase over the previous record of 85.5 GW set in August 2023. The peak occurred during a severe heat wave, with natural gas and solar providing 48% and 32% of the generation, respectively. As heat waves persist, the risk of further demand spikes remains high, directly benefiting independent power producers like Vistra that offer flexible, dispatchable generation capacity essential for grid stability. The market is pricing in the potential for higher wholesale electricity prices and increased utilization rates for Vistra’s assets during these extreme weather events.
VST Outperforms Sector Amidst Mixed Energy Sentiment
While the broader Independent Power and Electricity producers sector faces mixed headwinds, Vistra’s momentum stands out against its peers. The sector leader, NextEra Energy (NEE), experienced a slight intraday decline of 0.77%, highlighting a divergence in market sentiment. While large-cap utilities like NEE may be weighed down by interest rate sensitivities or renewable investment cycles, independent producers like Vistra are currently favored due to their direct exposure to spot price volatility and peaking power demand. The sector news highlights a global surge in energy infrastructure investment, from NTPC’s $178bn plan in India to new gas projects in Missouri, but VST’s move is specifically tied to the immediate, localized urgency of the Texas grid’s record loads, giving it a distinct short-term advantage over broader utility indices.
Technical Breakout and Aggressive Options Strategies
The technical landscape for VST presents a complex but actionable setup. Despite the intraday rally, the stock remains in a short-term bearish trend and is trading below key moving averages.
• 30-day Moving Average: $158.23 (Price Below)
• 100-day Moving Average: $155.70 (Price Below)
• 200-day Moving Average: $163.80 (Price Below)
• RSI: 41.53 (Neutral to Bearish)
• MACD Histogram: -1.71 (Bearish Momentum)
• Bollinger Bands: Upper $169.46, Middle $156.71, Lower $143.95
The stock is currently trading just below the middle Bollinger Band ($156.71) and the 100-day MA ($155.70), which now act as immediate resistance. The RSI at 41.53 indicates the stock is not yet oversold but lacks bullish momentum. The negative MACD histogram confirms that the broader trend remains downward, suggesting this rally may be a short-covering bounce rather than a trend reversal. Traders should view any move toward $158–$159 as a potential selling opportunity unless volume expands significantly to break above the 30-day MA.
For options traders seeking asymmetric risk/reward, we identify two high-potential contracts from the August 7 expiration chain that offer strong gamma and theta characteristics suitable for short-term volatility plays.
Contract 1: VST20260807C143VST20260807C143--
• Code: VST20260807C143 (Call)
• Strike: $143
• Expiration: 2026-08-07
• Key Stats: IV Ratio 81.81%, Leverage 11.56x, Delta 0.81, Theta -1.31, Gamma 0.018, Turnover $109,000
• Delta (Price Sensitivity): Measures how much the option price changes for a $1 move in the stock.
• Theta (Time Decay): Represents the daily loss in option value due to the passage of time.
• Gamma (Acceleration): Indicates the rate of change of the delta, showing sensitivity to price movement.
• Turnover (Liquidity): Total dollar value traded, indicating ease of entry and exit.
• IV Ratio (Volatility): Implied Volatility Ratio, reflecting expected price fluctuation.
• Leverage (Efficiency): The ratio of the stock's price to the option's price, showing potential return multiplier.
This deep-in-the-money call offers high delta (0.81) for near-stock-like exposure with significant gamma (0.018) to capture rapid upside moves. The high turnover of $109,000 ensures excellent liquidity, while the steep theta (-1.31) demands a quick trade. Payoff Calculation: If VST rises 5% to $162.02, the call payoff is max(0, 162.02 - 143) = $19.02 per share, offering substantial profit potential from a modest underlying move.
Contract 2: VST20260807C145VST20260807C145--
• Code: VST20260807C145 (Call)
• Strike: $145
• Expiration: 2026-08-07
• Key Stats: IV Ratio 79.85%, Leverage 13.47x, Delta 0.78, Theta -1.31, Gamma 0.021, Turnover $28,332
• Delta (Price Sensitivity): Measures how much the option price changes for a $1 move in the stock.
• Theta (Time Decay): Represents the daily loss in option value due to the passage of time.
• Gamma (Acceleration): Indicates the rate of change of the delta, showing sensitivity to price movement.
• Turnover (Liquidity): Total dollar value traded, indicating ease of entry and exit.
• IV Ratio (Volatility): Implied Volatility Ratio, reflecting expected price fluctuation.
• Leverage (Efficiency): The ratio of the stock's price to the option's price, showing potential return multiplier.
This slightly less deep-in-the-money call offers higher leverage (13.47x) and superior gamma (0.021) compared to the $143 strike, making it more sensitive to price increases. The lower turnover is still sufficient for execution. Payoff Calculation: If VST rises 5% to $162.02, the call payoff is max(0, 162.02 - 145) = $17.02 per share. This contract is ideal for traders betting on a continuation of the intraday momentum.
Aggressive bulls may consider VST20260807C145 into a bounce above $156.71 to test the 100-day MA.
Monitor Grid Stress for Sustained Momentum
The sustainability of Vistra’s rally hinges on the persistence of extreme weather conditions in Texas. If ERCOT continues to report record peak loads, the fundamental support for higher power prices will remain intact, potentially pushing VST toward the $158–$159 resistance zone. However, traders must remain cautious of the overarching bearish technical structure, including the stock’s position below its 30, 100, and 200-day moving averages. Watch for a decisive break above $158.50 on high volume to confirm a trend change; otherwise, expect mean reversion. In contrast, sector leader NextEra (NEE) declined 0.77%, underscoring that this move is idiosyncratic to VST’s exposure to peaking demand. Investors should focus on the daily grid load reports as the primary driver for short-term price action.

TickerSnipe provides professional intraday stock analysis using technical tools to help you understand market trends and seize short-term trading opportunities.
Latest Articles
Stay ahead of the market.
Get curated U.S. market news, insights and key dates delivered to your inbox.


AInvest
PRO
AInvest
PRO




Comments
No comments yet