
VisionSys Surges 20% — But Volume Says 'Trap'
VisionSys (Nasdaq: ) stock is moving sharply in pre-market trading. The micro-cap equity has surged nearly 20% to trade around $0.68. This move comes without a clear news catalyst or significant volume confirmation. That said, the price action stands out against a backdrop of broader market weakness. The Nasdaq futures are down 0.7%, yet VisionSysVSA-- is climbing. In reality, this divergence suggests a liquidity-driven spike rather than a fundamental shift. The stock is currently trading well below its 20-day moving average, which sits at $1.05. Put differently, the market is testing a volatile resistance zone after a long, painful decline.
Why is VSAVSA-- stock dropping today?
Technically, the primary trend remains deeply bearish. VisionSys has been in a consistent downtrend for months, hitting new lows recently before this sudden spike. The 60-day returns are deeply negative, placing the stock in the bottom percentile of its historical range. This pre-market surge looks like a short-covering rally or a thin liquidity event rather than a sustained reversal. The relative volume is weak, sitting at just 5% of the 20-day average. This lack of participation is a major red flag for sustained upside. To put numbers on it, the stock needs to clear $1.00 to prove this is anything more than a trap. Without volume support, such moves often fizzle out quickly.
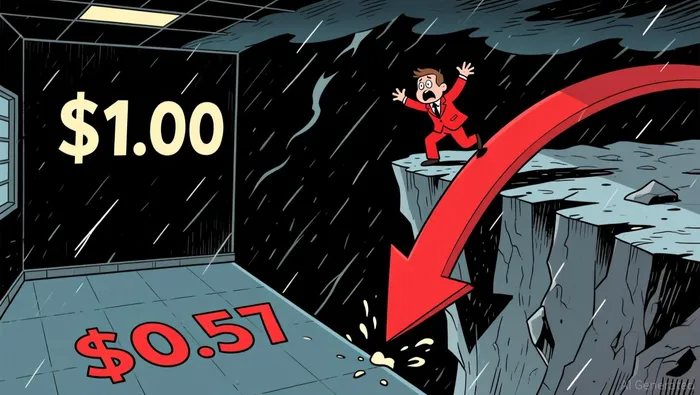
The chart structure tells a story of exhaustion rather than strength. Resistance is thick at the $1.00 psychological level and the $1.05 moving average. These are hard barriers for a stock with no earnings beat or strategic news driving it. If buyers cannot push through these levels with heavy volume, the path of least resistance remains down. The nearest support is currently $0.57, which acts as a floor for the recent consolidation. A break below this level would invalidate the current bounce and signal a return to the prevailing downtrend. Crucially, traders should expect high volatility as the stock tries to find a true equilibrium price.
What support and resistance levels define the next move?
Scenario analysis points to a high probability of failure for this rally. The most likely outcome is a quick reversal or a "fake out" where the price grinds back to previous lows. The probability of this failure scenario is nearly 46%, the highest among all technical setups. This view is reinforced by the absence of a confirmed breakout structure. The stock is still range-bound, merely oscillating within a narrow band defined by the recent lows and the current spike. For now, the $0.57 level is the critical line in the sand. Hold it, and the stock might drift higher. Lose it, and the decline resumes with force. The $1.00 level remains the key resistance that must be breached to change the narrative.
Market participants should approach this with extreme caution. The lack of volume means the move is fragile. A single large sell order could trigger a cascade of stops, sending the price plummeting back toward $0.53. Conversely, a sustained push above $1.00 would require a fundamental reason, which is currently missing. Until then, the market is pricing in uncertainty. The bottom line is clear: this is a high-risk environment where technical levels matter more than news headlines. Keep an eye on the $0.57 support and the $1.00 resistance to gauge the true sentiment of the market.
VisionSys (VSA) stock news for today highlights a classic micro-cap volatility event. The $0.57 to $1.00 range is the critical zone for the next few sessions. Investors should monitor why is VSA stock dropping today if the support at $0.57 fails. The stock remains a speculative play with significant downside risk until volume confirms a trend reversal.
Get the scoop on pre-market movers and shakers in the US stock market.
Latest Articles
Stay ahead of the market.
Get curated U.S. market news, insights and key dates delivered to your inbox.
AInvest
PRO
AInvest
PRO
Comments
No comments yet