
VIP Graph: GS Predicts 3% Annualized Returns for S&P 500 Over the Next Decade
1. S&P 500 Valuations Near Historic Highs
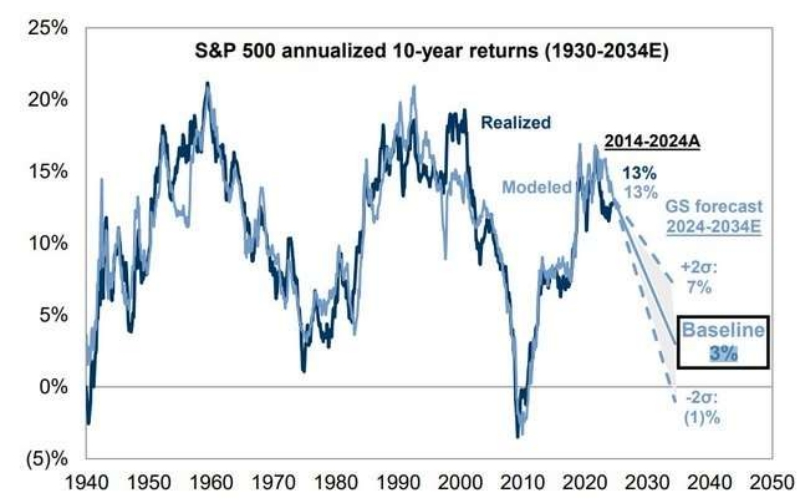
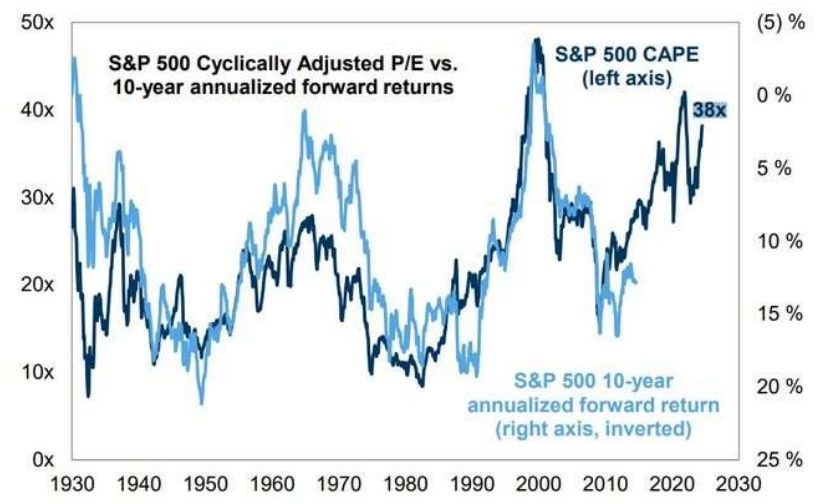
According to Goldman Sachs, the S&P 500's CAPE (Cyclically Adjusted Price-to-Earnings) ratio currently stands at 38, placing it in the 97th percentile of historical valuations. Only during the 2000 dot-com bubble peak and the pre-rate hike period at the end of 2021 were valuations higher. Goldman projects annualized returns for US stocks over the next decade to be just 3%, with a range of -1% to +7%.
2. Impact of Bond Yields on Valuations
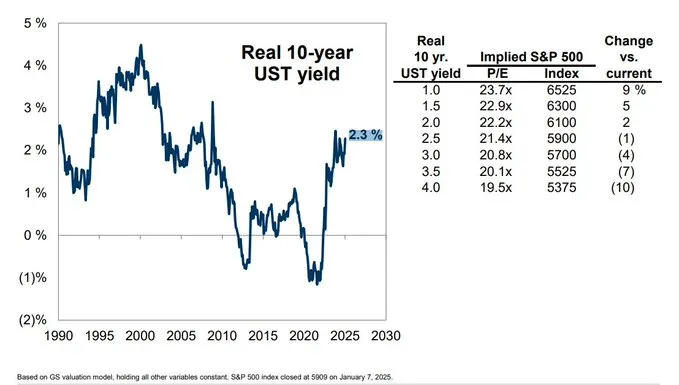
Goldman Sachs notes that a 50-basis-point increase in US Treasury real yields could reduce the valuation of the S&P 500 by approximately 3%.
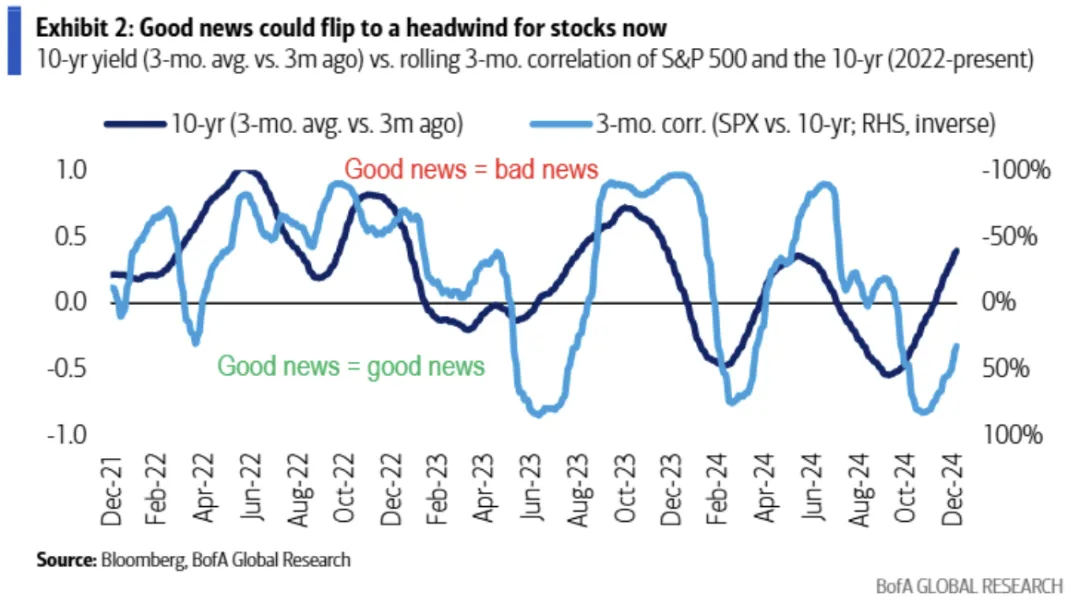
3. Correlation Between S&P 500 and Treasury Yields
Bank of America research shows that the correlation between the S&P 500 and the 10-year US Treasury yield is closely tied to the absolute level of the 10-year yield. If the 10-year yield remains above 4.5%, markets may shift to a good news is bad news environment—where positive economic data leads to expectations of prolonged restrictive Fed policy, thus pressuring stock prices, similar to 2022.
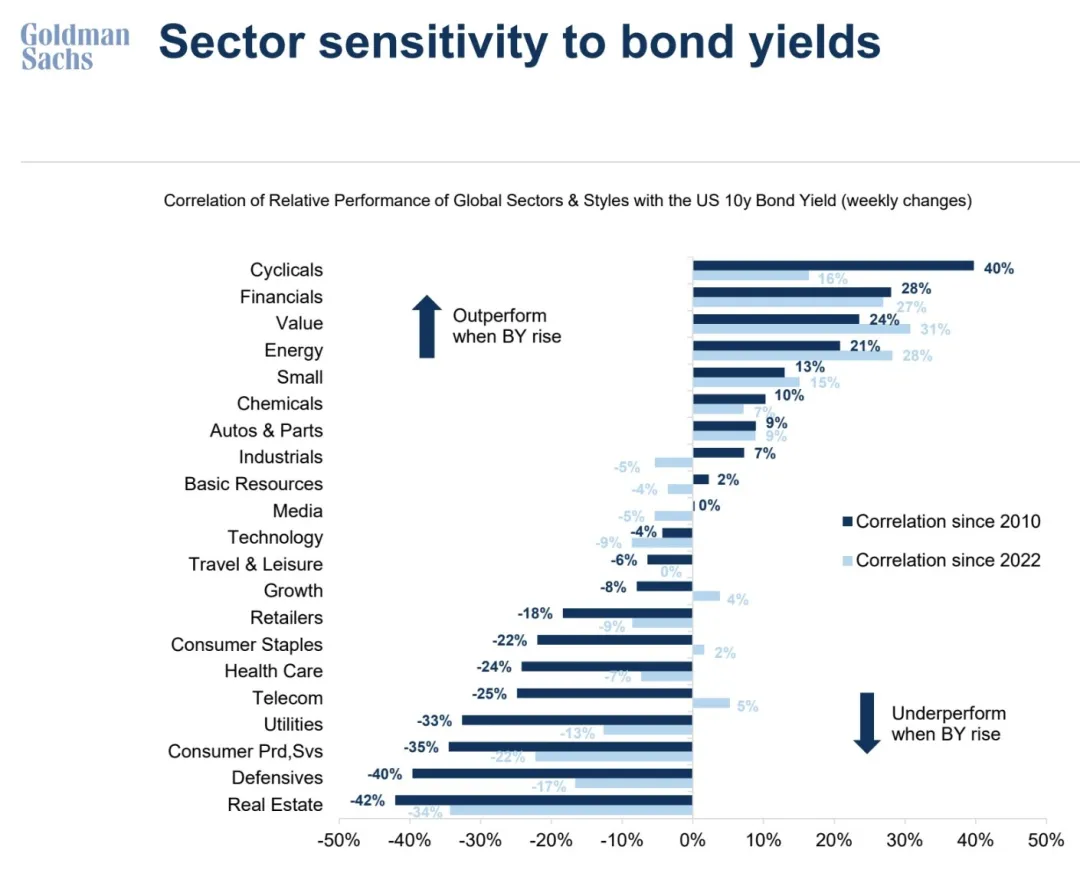
 4. Sector and Style Sensitivities to Yield Changes
Goldman Sachs highlights how various US equity sectors and styles respond to changes in the 10-year Treasury yield. Data from 2022 reveals that value stocks benefit the most from rising yields, while the real estate sector suffers the greatest impact.
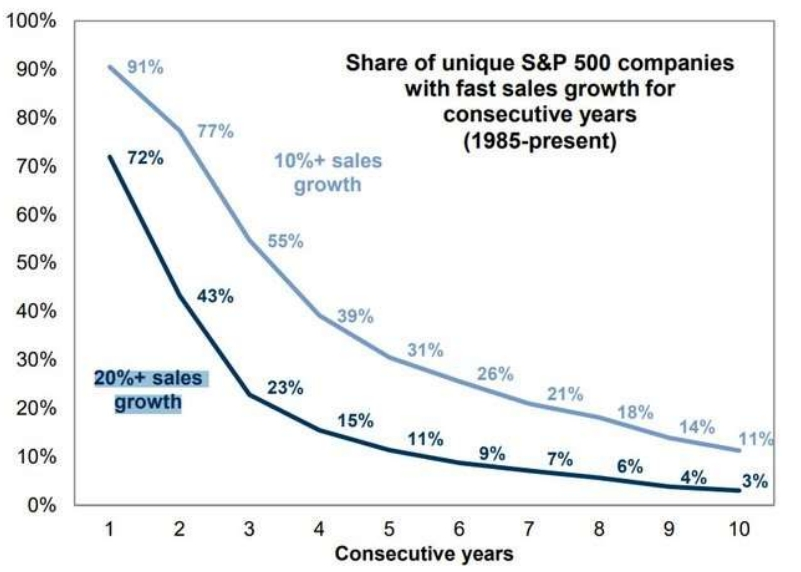
 5. Sustaining High Growth Is Rare
Over the past 40 years (since 1985), only 3% of US companies have managed to sustain annual revenue growth above 20% for ten consecutive years. Additionally, just 11% of companies have consistently achieved revenue growth above 10% annually over the same period.
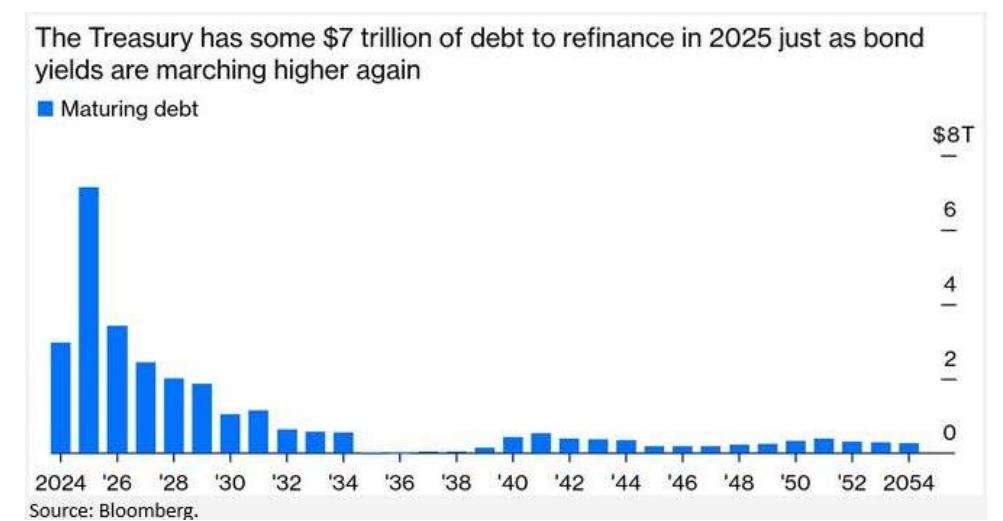
 6. US Treasury's 2025 Refinancing Hurdle
The US Treasury faces a substantial refinancing challenge in 2025, with approximately $7 trillion in debt maturing—the largest refinancing requirement over the next 30 years. This is a sharp increase from the $2.3 trillion maturing in 2024.
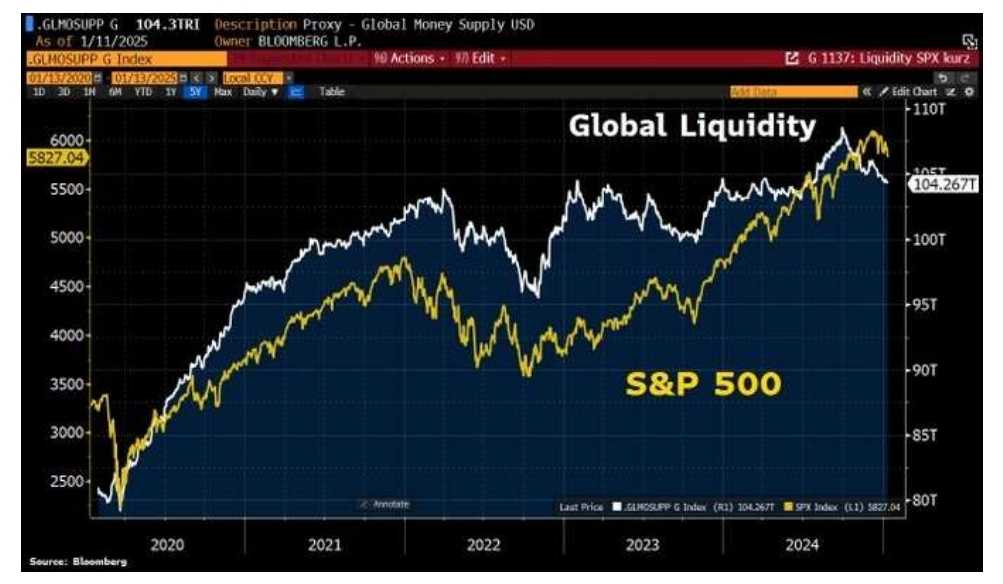
7. Global Liquidity Concerns vs. Buy-Side Reserves
Recent global equity market volatility has been attributed to reduced liquidity, with the global money supply contracting by $4.2 trillion.
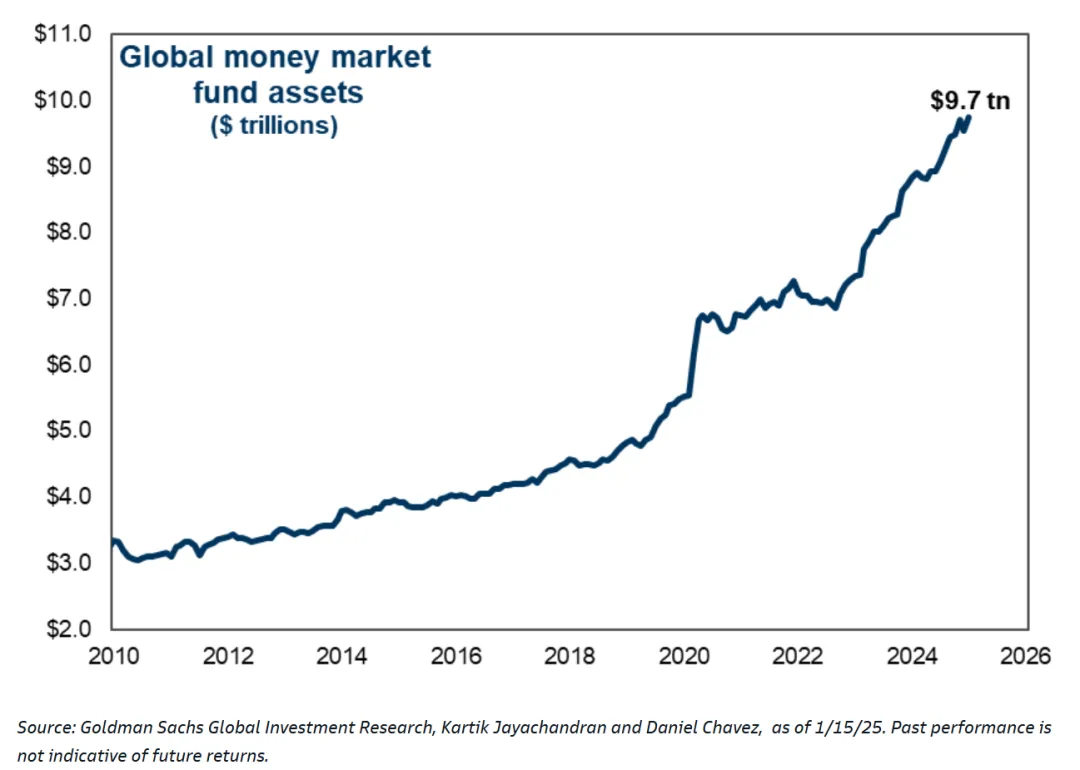
However, there is significant dry powder waiting on the sidelines. Global money market funds saw inflows of $143.3 billion last week, marking the largest weekly inflow since March 2020. The total assets of global money market funds now stand at a staggering $97 trillion.
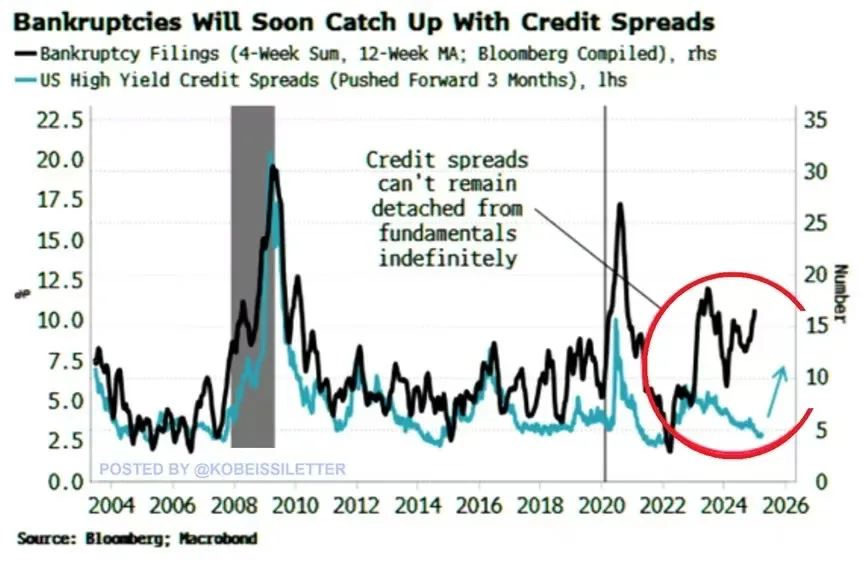
8. US Corporate Bankruptcies on the Rise
The 12-week moving average of US corporate bankruptcy filings has reached 17, the highest level in two years, comparable to the 2008 financial crisis and the 2020 pandemic. This indicates a significant deterioration in the debt repayment capacity of small businesses.
Despite this, the market remains indifferent, with US junk bond yields still near historic lows. As the Fed maintains restrictive rates for a longer duration, junk bond yields are likely to rise soon.
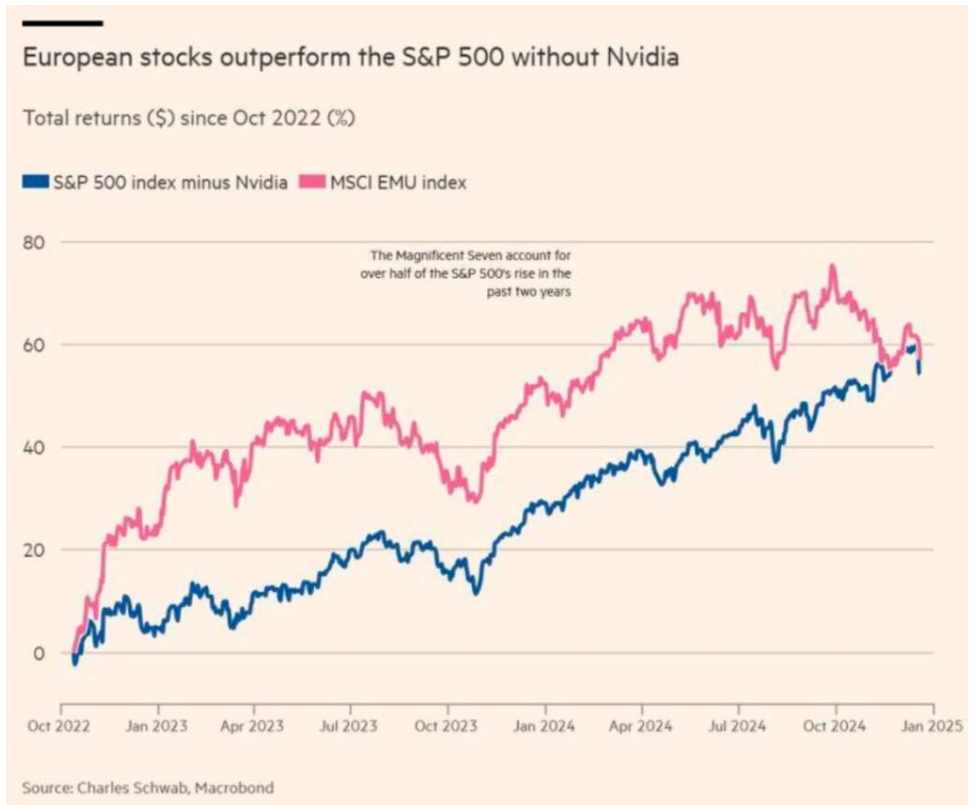
9. Nvidia's Outsized Impact on the S&P 500
Nvidia's influence on the S&P 500 has been remarkable. Excluding Nvidia (as shown by the blue line in the chart), the S&P 500's total return since the start of the new bull market at the end of 2022 has underperformed the benchmark index for the Eurozone.
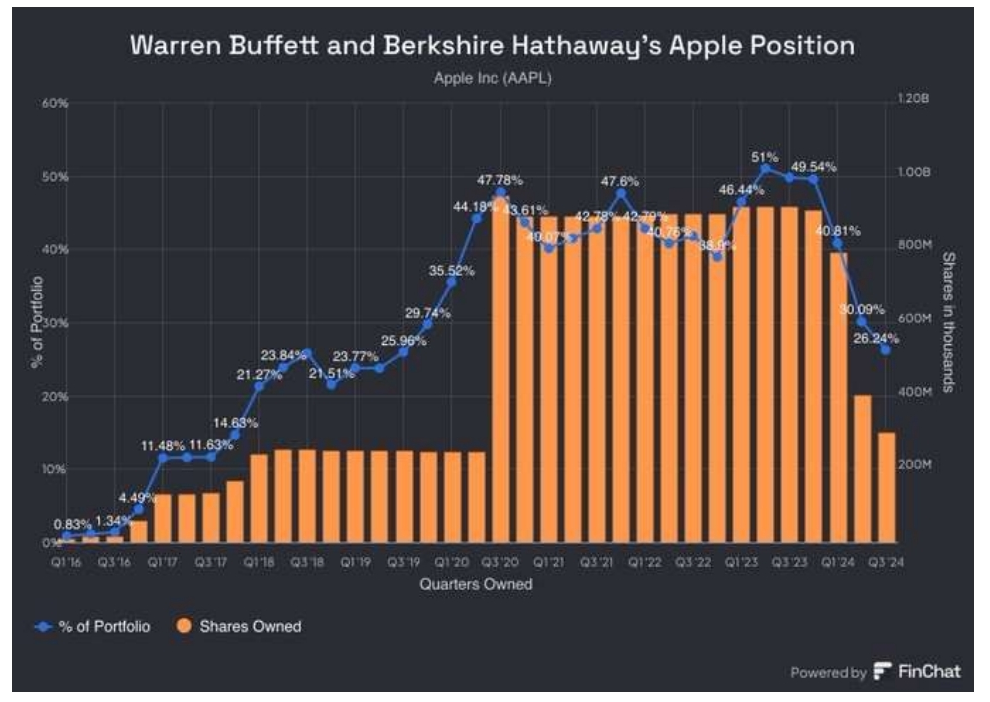
10. Buffett's Apple Stock Reduction
Starting in 2024, Warren Buffett has significantly reduced Berkshire Hathaway's Apple holdings. What foresight has the Oracle of Omaha see?
Independent investment research powered by a team of market strategists with 20+ years of Wall Street and global macro experience. We uncover high-conviction opportunities across equities, metals, and options through disciplined, data-driven analysis.
Latest Articles
Unlock Market-Moving Insights.
Subscribe to PRO Articles.
Already have an account? Sign in
Unlock Market-Moving Insights.
Subscribe to PRO Articles.
Already have an account? Sign in
Stay ahead of the market.
Get curated U.S. market news, insights and key dates delivered to your inbox.
