
Is This Violent Reversal a Classic S&P 500 Buy Signal?


U.S. stocks suddenly plunged from the highs. The S&P 500 opened nearly 2% higher but closed down 1.6%. BitcoinBTC-- also fell below the $90,000 mark. What happened to risk assets?
Heavyweight U.S. stocks opened the session “calm, steady, and comfortable,”
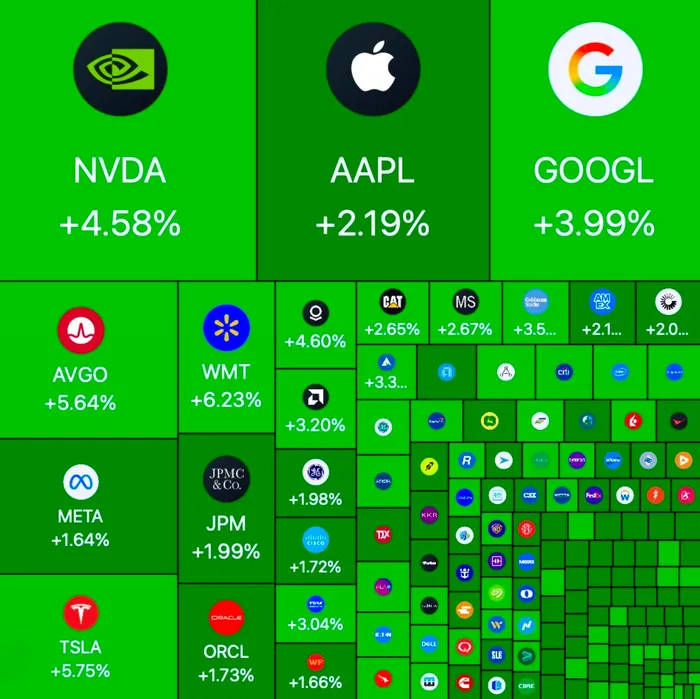
but closed the day “rushing, stumbling, and tumbling.”
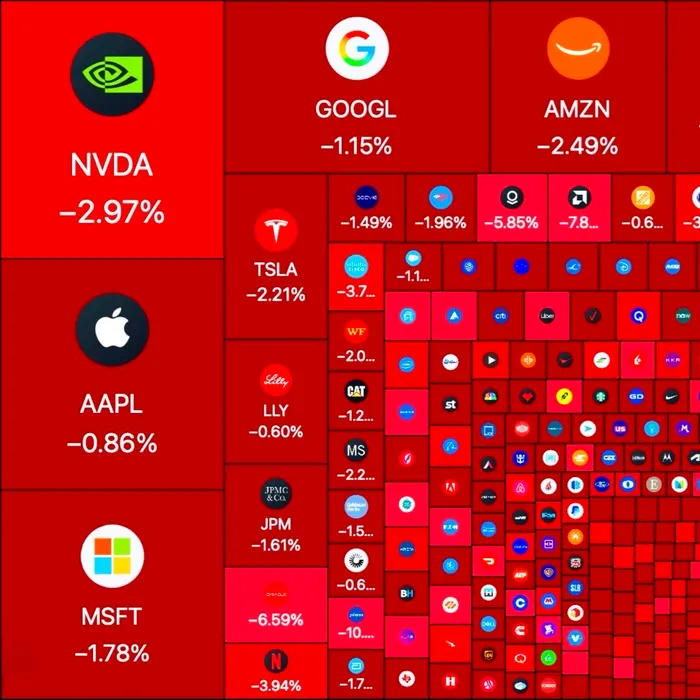
Don’t panic. This pattern—soaring at the open and plunging intraday—has only appeared twice in recent years: once on April 7, 2020 (the pandemic crash), and once on April 8, 2025 (the bottom formed on Trump’s “reciprocal tariffs”). Both were historic market bottoms.
Including today, since 1957 the S&P 500 has seen only eight instances where it opened more than 1% higher but still closed lower. After these eight “high open, deep fade” events, S&P 500 performance was: +2.33% on average after 1 day, +2.88% after 1 week and +4.72% after 1 month.
Why did U.S. stocks open strong but close in a deep selloff?
Many research firms tried to pin down the exact cause of the plunge, but none found a definitive explanation. Let’s first look at the Goldman SachsGS-- trading desk, which sits closest to the market.
Goldman’s trading team observed increased short positioning across ETFs, stock baskets, and index futures. They also noted poor liquidity: S&P 500 order-book depth fell below $5 million, compared with the one-year average of $11.5 million, which may have amplified volatility.
Goldman’s derivatives team added that early in the session, trading activity was extremely heavy, driven by hedge unwinds and increased exposure to volatility futures. They did not observe panic selling. Instead, it looked more like traders digesting macroeconomic headwinds while waiting for the next upside catalyst.
Analysts’ Views
“Nvidia’s results were positive but not enough to eliminate concerns that AI valuations are too high and that the recent shift toward debt financing signals overly aggressive investment and insufficient focus on shareholder returns,” said Sameer Samana, head of global equities and real assets at Wells Fargo.
“The optimism after Nvidia’s earnings was mostly short covering. The market is rethinking the ROI of AI investment,” said Greg Taylor, CIO of PenderFund Capital Management.
“Traders are worried whether today’s massive AI investments will be profitable five years from now, and some chose to lock in gains,” said Matt Maley, chief market strategist at Miller Tabak + Co. LLC.
Some analysts also pointed to the linkage between U.S. equities and crypto assets.
“As cryptocurrencies move into a bear market, cross-asset deleveraging is not yet over. Retail investors dominate crypto, and since last spring, retail flows have driven the market higher. The vulnerability is obvious,” said Frank Monkam, head of cross-asset macro strategy and trading at Buffalo Bayou Commodities.
This view is shared by Interactive Brokers’ chief strategist Steve Sosnick. He noted Bitcoin’s fall below the $90,000 mark, calling it a real-time signal of investors’ overall appetite for risk.
Morgan Stanley’s latest report added that the U.S. added 119,000 nonfarm payroll jobs in September, well above expectations, indicating a resilient labor market. They no longer expect the Federal Reserve to cut rates in December.
Expert analysis on U.S. markets and macro trends, delivering clear perspectives behind major market moves.
Latest Articles
Stay ahead of the market.
Get curated U.S. market news, insights and key dates delivered to your inbox.
AInvest
PRO
AInvest
PRO
Comments
No comments yet