
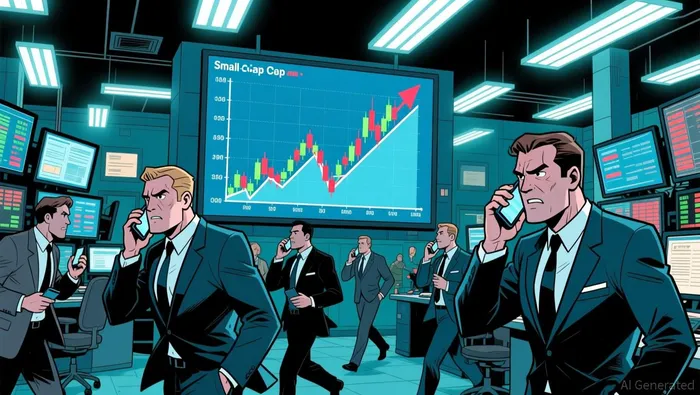
VGAS Drops 5.27% on New CEO and Strategic Review — But Volume Tells a Different Story
The Nasdaq-listed micro-cap stock of Verde Clean FuelsVGAS-- (VGAS) experienced a sharp drop in pre-market trading, with the stock falling 5.27% to $1.6294. The move came amid a broader market decline, with the Nasdaq futures dropping 0.63%, and the S&P 500 futures down 0.43%. Given the magnitude of the drop and the pre-market timing, investors are asking: Why is this stock falling today?
Why is the stock moving today?
Verde Clean Fuels has announced the appointment of George Burdette as its new CEO and the engagement of Roth Capital Partners as a financial advisor to explore strategic options, including a potential merger or sale. This marks a significant shift in the company’s direction and has sparked speculation about a possible strategic transaction.
The stock’s sharp drop appears to be part of a broader re-pricing event, as investors may be reassessing the company’s valuation amid the strategic uncertainty. The move also aligns with the stock’s recent volatility, which has seen it trade between a 60-day low of $0.92 and a high of $2.68.
What supports or weakens the price move?
The key driver of the move is the new CEO announcement and the strategic review. However, the volume and participation metrics tell a different story. While the price action was significant, the volume remains well below the 60-day average and is currently at the 3.3% percentile of historical volume levels.
This weak volume suggests that the price move is not being backed by strong institutional or retail participation. The price drop lacks the kind of robust volume that would signal a high conviction trade, such as a confirmed breakout or a reversal with strong follow-through.
Moreover, the stock is currently near its 20-day moving average of $1.60, but it has not broken through any key resistance or support levels in a meaningful way. The Relative Strength Index (RSI) at 65 suggests the stock is not in overbought territory, but it is also not showing clear bearish divergence that would support a deeper decline.
What levels or signals should investors watch next?
Investors should keep an eye on several key price levels to gauge the stock’s next move. The nearest support level is at $1.60, which is also the 20-day moving average. If the stock falls below this level, it could signal a breakdown in the near-term range and increase the likelihood of a more significant pullback.
On the flip side, a move back above the $1.63 level could indicate that the sell-off is merely a temporary correction rather than a trend reversal. Additionally, the stock will be watched for signs of increased volume, particularly if it rises above the 20-day average of roughly 58,274 shares.
In the short term, the stock is expected to remain in a range-bound pattern, with a higher probability of a failure or false break scenario. This means the stock could either consolidate around its recent range or potentially reverse back toward its 20-day average.
Crucially, investors should also monitor for any new catalysts in the coming days, such as further news from the company or developments in the broader market. Given the stock’s low market cap and thin liquidity in pre-market hours, it’s important to wait for the open of the regular trading session to get a clearer read on the move’s validity.
At the end of the day, the stock’s near-term path will depend on a combination of news, volume, and technical support/resistance levels. Watch for any follow-through in the next couple of sessions to determine whether the recent drop was a signal of a broader trend or a temporary correction.
As always, investors should consider the broader market context and use a disciplined approach when interpreting price action and volume signals.
( support and resistance levels)
Get the scoop on pre-market movers and shakers in the US stock market.
Latest Articles
Stay ahead of the market.
Get curated U.S. market news, insights and key dates delivered to your inbox.
AInvest
PRO
AInvest
PRO
Comments
No comments yet