
AInvest Newsletter
Daily stocks & crypto headlines, free to your inbox
As of October 2025,
(VET) occupies a precarious yet strategically significant position in its price trajectory. The token has oscillated between bearish consolidation and emerging bullish momentum, with mixed signals from technical indicators and smart money activity. While the Fear & Greed Index reads 49 (neutral sentiment) as of late September 2025, according to , a competing metric suggests extreme fear at 9.31, per , underscoring the market's fragmented psychology. This duality reflects a critical juncture for , where short-term traders and long-term investors must weigh technical catalysts against broader market dynamics.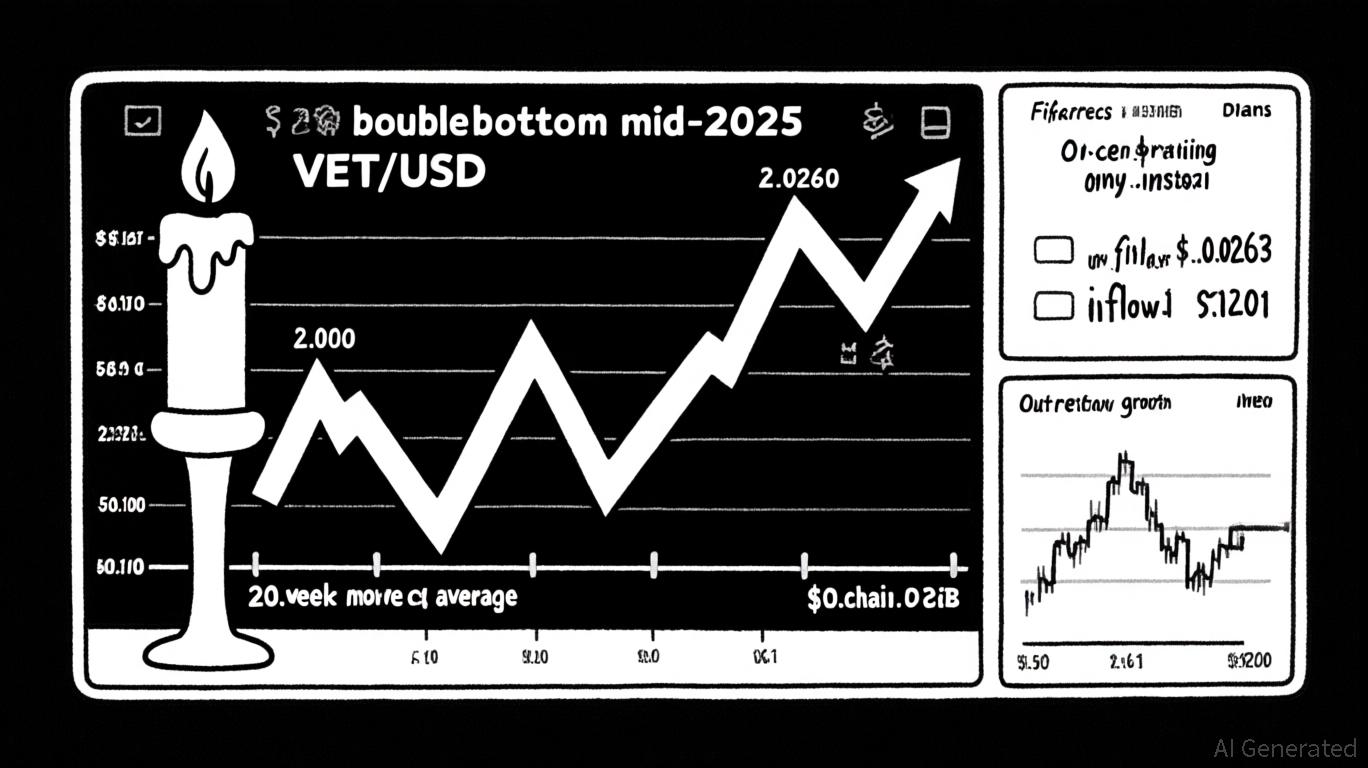
VET's price action has formed a double-bottom pattern below the 20-week moving average, a classic accumulation structure that analysts like Michaël van de Poppe have flagged as a long-term opportunity, according to a CoinEdition analysis. The token's recent recovery from the $0.0100 capitulation zone has stalled near $0.0201, a level aligned with the 61.8% Fibonacci retracement of its decline from $0.0263 to $0.0100, as CoinEdition reports. This resistance is fiercely defended by sellers, with price repeatedly retreating toward the 50% retracement at $0.0181, per the same CoinEdition coverage.
A sustained close above $0.0201 would invalidate the bearish narrative and open the path to $0.0228 (78.6% Fibonacci) and beyond. Conversely, a breakdown below $0.0162 (38.2% retracement) could confirm a continuation of the downtrend, targeting the psychological floor at $0.0100. The 20-week moving average itself, currently between $0.0191 and $0.0222, acts as a dynamic battleground, with its slope and proximity to price dictating short-term volatility - observations echoed in CoinEdition's market commentary.
Historical backtesting of VET's price behavior around resistance levels reveals cautionary insights. Between 2022 and October 2025, 15 instances occurred where VET closed above its prior 60-day high (a proxy for resistance breakouts). However, the average cumulative return 30 days post-breakout was –8.85%, with only 20% of events yielding positive outcomes. Returns turned negative rapidly, declining –2.72% after two days and –5.84% after five days. These results suggest that false breakouts or rapid mean reversion have historically undermined the reliability of this strategy for VET.
A confirmed breakout above $0.0201 could trigger a rally toward $0.0245 and $0.0263, though CoinEdition's price coverage cautions traders to watch for confirmation. However, given the historical underperformance of resistance breakouts, traders should consider additional filters-such as volume surges or trend-strength metrics-to distinguish genuine momentum from false signals.
Smart money activity provides a more nuanced picture. Open interest for VET derivatives has surged by 3.6% in the last 24 hours, reaching $50.24 million by mid-October 2025, according to CoinEdition's derivative-flow update. This growth, coupled with on-chain inflows slightly exceeding outflows since July 2025 (also reported by CoinEdition), suggests cautious accumulation by institutional and savvy retail traders. However, a recent $502,000 net outflow as prices dipped to $0.01822 signals short-term profit-taking or reduced demand.
The stability of open interest amid moderate price swings indicates that derivatives traders are regaining confidence. This could lead to heightened volatility as momentum builds, particularly if VET breaks out of its narrowing channel. Analysts argue that a breakout above $0.0201 would validate the bullish case, with price targets extending to $0.0245 and $0.0263, an outlook reflected in CoinEdition's analysis.
Key levels to monitor in October 2025 include:
- Resistance: $0.0201 (61.8% Fibonacci), $0.0212 (100-EMA), $0.0228 (78.6% Fibonacci).
- Support: $0.0181 (50% retracement), $0.0162 (38.2%), $0.0138 (23.6%), and the critical $0.0100 floor.
A confirmed breakout above $0.0201 could trigger a rally toward $0.068 and $0.12, as suggested by Fibonacci projections and the Cup & Handle pattern on the monthly chart, per CoinEdition's accumulation piece. Conversely, a breakdown below $0.0162 would likely reignite bearish sentiment, testing the $0.0100 level.
VET's fundamentals in real-world supply chain solutions and staking incentives (e.g., StarGate) remain a long-term tailwind, as discussed in CoinEdition's accumulation coverage. However, short-term momentum hinges on macroeconomic factors and cross-chain adoption. The token's recent 22.40% 24-hour price decline, noted in a
, highlights its vulnerability to broader market sentiment, yet its undervaluation relative to fundamentals suggests a potential rebound.VET's price action in October 2025 reflects a tug-of-war between bearish consolidation and emerging bullish momentum. While Fibonacci levels and open interest metrics suggest a potential breakout, traders must remain cautious of short-term volatility and the risk of a breakdown below $0.0162. For those with a medium-term horizon, a strategic entry near $0.0181–$0.0162 could offer asymmetric upside if the token regains its footing above $0.0201.
AI Product Manager at AInvest, former quant researcher and trader, focused on transforming advanced quantitative strategies and AI into intelligent investment tools.

Dec.03 2025

Dec.01 2025

Nov.27 2025

Nov.27 2025

Nov.27 2025
Daily stocks & crypto headlines, free to your inbox


Comments
No comments yet