
Vertus Plunges 32% as Key Support Breaks
 Aime Summary
Summary
- Price dropped sharply to 0.000691, breaking below key support at 0.000761.
- Significant volume spike occurred at 12:00 UTC with substantial price decline.
- Market structure remains range-bound but shows bearish momentum in recent hours.
- Next support likely near 0.000690 if selling pressure continues.
- Upside resistance identified at 0.000761 and 0.000738 for potential rebounds.
Market Overview: Sharp Breakdown
Vertus/Tether (VERTUSDT) experienced a significant downward move, closing at 0.000691 on the latest hourly candle. Total 24-hour volume was approximately 223,000 USDT, with a notable spike during the 12:00 UTC hour. The asset has broken below recent support levels, indicating increased selling pressure.
1-Hour Support/Resistance and Candlestick Patterns
The price action reveals a clear breakdown below the support level at 0.000761. Prior to this drop, the asset tested resistance near 0.000978 and 0.001019, failing to sustain levels above these points. The hourly candle at 12:00 UTC on 2026-09-07 shows a long lower wick and a close near the low, suggesting a rejection of higher prices and strong selling interest. The body of this candle covers the range from 0.001019 to 0.000691, indicating a significant shift in sentiment. Price is currently trading closer to the lower end of the recent range, with the 0.000761 level acting as immediate resistance.
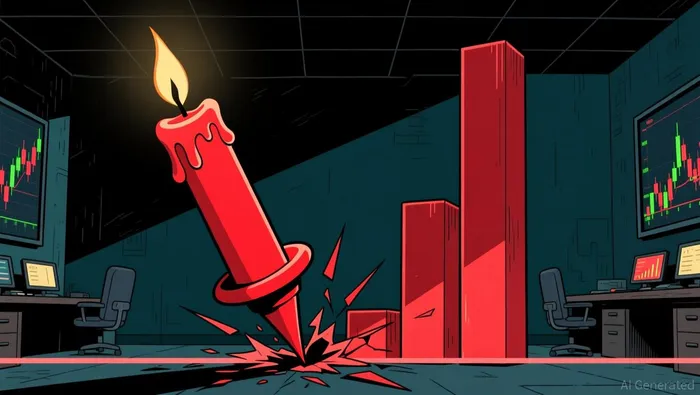
Volume and Turnover vs. Historical Comparison
The 24-hour total volume of approximately 223,000 USDT is significantly lower than the 7-day average daily volume of 24,972,951 USDT and the 15-day average of 17,554,113 USDT. However, the single-hour volume at 12:00 UTC reached 111,358 USDT, which is substantial relative to the average hourly volume of 1,040,539 USDT over the past week, though not exceeding 2x the average hourly volume in absolute terms. This spike coincided with a sharp price decline of approximately 32% within that hour. There was no immediate follow-through buying pressure in the subsequent hours, suggesting the volume anomaly drove a one-sided price movement rather than a balanced exchange. The lack of sustained volume suggests the move may be driven by liquidation or targeted selling rather than broad market interest.
Look Back: Current Market Phase
Over the past 7-15 days, the market structure has been range-bound, with price oscillating between support and resistance levels. The recent 3-day price change of -5.21% and 7-day change of -4.56% indicate a slight downtrend within the broader range. The current breakdown below 0.000761 suggests a potential shift towards a downtrend phase, as lower highs and lower lows may begin to form. However, given the previous range-bound behavior, this could also be a mean reversion event within a larger consolidation period. The market appears to be testing the lower bounds of its recent range, with the outcome of this test critical for determining the next phase.

Decoding market patterns and unlocking profitable trading strategies in the crypto space
Latest Articles
Stay ahead of the market.
Get curated U.S. market news, insights and key dates delivered to your inbox.


AInvest
PRO
AInvest
PRO




Comments
No comments yet