
Vertiv Holdings Outlook: Navigating Technical Neutrality and Mixed Analyst Signals
Market SnapshotHeadline: VertivVRT-- remains in technical limbo with conflicting signals. The stock shows signs of indecision, with mixed indicators suggesting that traders are waiting for a clear direction before committing.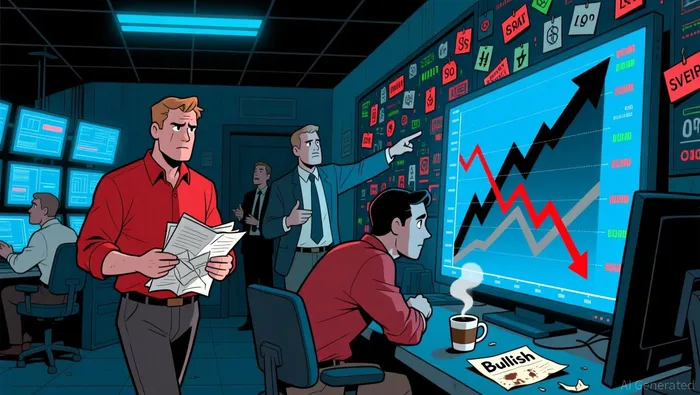
News HighlightsRecent headlines have underscored broader economic and sector-specific shifts. For example, the Indian construction equipment industry is expected to see double-digit growth in FY26, which may indirectly benefit Vertiv if infrastructure demand increases. Meanwhile, steel tariffs in the U.S. are rising, a development that could impact manufacturing costs for equipment suppliers like Vertiv. The construction and energy sectors remain under pressure from trade policy shifts, which could ripple through industrial players.
Analyst Views & FundamentalsAnalysts remain divided. The simple average rating is 4.33, while the performance-weighted rating is slightly lower at 3.50. The disparity reflects inconsistent expectations and performance history among the three institutions involved. Citigroup has the most favorable history (66.7% win rate) with a Strong Buy rating, while Wolfe Research's Neutral rating lags with a 0.0% win rate. Goldman Sachs also issued a Strong Buy in the last 20 days, though its historical accuracy is only 50%.
From a fundamental standpoint, here are the key metrics:EV/EBIT: 48.73 — internal diagnostic score: 4.0, indicating low efficiency.Gross Profit Margin (GPM): 37.77% — internal diagnostic score: 3.0, showing moderate profitability.Cash to Upcoming Payments (Cash-UP): 95.47% — internal diagnostic score: 3.0, indicating strong liquidity.CFOA (Cash Flow from Operating Activities): 10.49% — internal diagnostic score: 4.0, suggesting reasonable operating cash flow.Net Income to Revenue: 33.56% — internal diagnostic score: 1.0, reflecting a low net margin.These metrics highlight a mixed picture — some areas (liquidity and cash flow) are strong, while others (profitability and efficiency) are underperforming.
Money-Flow TrendsBig money and retail investors are both cautious, with inflow ratios hovering just below 50% across all categories (Small: 48.85%, Medium: 48.69%, Large: 48.41%, Extra-large: 48.57%). The fund-flow score is 7.88, which we classify as “good”, indicating a slight positive bias in the flow of capital despite the negative overall trend. This suggests that while institutional investors aren't heavily committing, they are not withdrawing either, maintaining a wait-and-see approach.
Key Technical SignalsVertiv's technical profile remains murky, with conflicting indicators:Williams %R Oversold — internal diagnostic score: 3.16, suggesting a weak bearish signal.Long Lower Shadow — internal diagnostic score: 7.54, indicating a strong bullish reversal.MACD Death Cross — internal diagnostic score: 6.23, signaling a bearish bias.Williams %R Overbought — internal diagnostic score: 6.15, showing a neutral rise.
Recent chart patterns include a Long Lower Shadow on 2025-12-11, a Williams %R Oversold on 2025-12-12, and a MACD Death Cross on the same day. The overall trend is technical neutrality with a suggestion to watch for further clarity in the next few weeks. Momentum is mixed, with no clear path forward at this time.
ConclusionWith conflicting signals from both technical analysis and analyst ratings, investors are advised to adopt a wait-and-see approach. Vertiv's internal diagnostic score of 5.77 for its recent technical indicators aligns with this cautionary stance. While fundamentals show pockets of strength, they are not enough to offset the volatility and uncertainty. Consider holding off on aggressive moves until more clarity emerges, especially if you're a retail investor seeking a clearer trend. For now, monitor both earnings reports and any trade policy updates that could reshape the broader industrial landscape.
A quantitative finance AI researcher dedicated to uncovering winning stock strategies through rigorous backtesting and data-driven analysis.
Latest Articles
Stay ahead of the market.
Get curated U.S. market news, insights and key dates delivered to your inbox.

Comments
No comments yet