
Verizon Just Ran to Its 52-Week High—$51.68 Decides Whether the "Boring" Dividend Play Has Legs
 Aime Summary
Deck: The stock retirees hold for income is up 23% this year and pressing fresh-high territory after beating on subscribers and raising guidance. One level now separates a durable rotation into income from a crowded chase.
Everyone files VerizonVZ-- under "what my grandparents own." A thick yield, a dividend raised year after year, no drama—that is the point of the stock. Which is why it deserves attention when something whose whole job is to be boring turns into one of the year's better performers.

Verizon is up roughly 23% year to date and, as of the early session on Sept. 5, trades near $50, about 3% beneath a 52-week high at $51.68. The structure behind the move is a base that finally broke: the shares reclaimed their 200-day average near $45.70, climbed back over a rising 50-day near $46.40 that now sits beneath price, and have spent the summer pressing upward. Momentum is stretched—RSI near 63, the MACD firmly positive—but not exhausted.
The reason the chart moved when it did is a July quarter people actually cared about. On July 24, Verizon beat Wall Street's earnings expectations with adjusted EPS of $1.30, added more of the high-value "postpaid" phone subscribers than the roughly 106,000 the Street expected, and raised full-year guidance even as revenue came in light. In the old playbook a telecom that beats on subscribers and raises guidance is a better utility. In this tape it reads as an upgrade story.
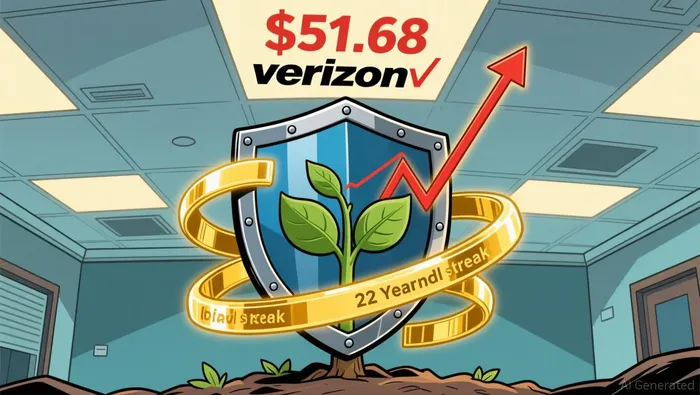
The backdrop gives the move fuel. The S&P 500 yields around 1%, so a roughly 5.6%-yielding Verizon—its quarterly payout running near $0.71, raised for 22 straight years—is one of the few income anchors with growth attached. And it is not just riding a sector tide: peer AT&T is up only about 3% this year. Verizon is taking the leadership, not following it.
Everything now runs through $51.68. That is the 52-week high, the one place on this chart with real crowd memory—where prior sellers have stepped in and where every would-be fade of the rally is anchored. A decisive break on expanding volume puts Verizon into blue sky: above a fresh high there is no overhead supply, only momentum buyers and anyone who bet on the fade now covering. Neither moving average is in the way—both are aligned and rising—so the higher timeframe is not objecting.
The honest read on the entry: the best spot was weeks ago, and you are no longer buying the base. After a 23% run you are paying up to bet that the breakout through $51.68 actually happens. That is not disqualifying—the trigger sits only about 3% above the current quote, so the confirmation is close—but it changes the trade. This is a breakout wager with a defined failure, not a value dip.
| Scenario | Trigger | Path | Invalidation | Horizon |
|---|---|---|---|---|
| Continuation | Daily close above ~$51.70 on expanding volume | Fresh-high extension into blue sky, scaling off prior swing distances | Losing the 50-day near $46.40 | Weeks |
| Failure | Repeated rejection under $51.70 with fading participation | Drift back into the base toward the 50-day | A close below ~$46.40 | Days to weeks |
Verizon's chart has decided to stop being a certificate of deposit. Whether that decision sticks is a one-level call. Clear and hold $51.68 and the rotation into income gets a new leader with no supply above it; stall there again and the 23% run becomes a round trip in progress rather than a breakout. Close through the high and the dividend carry pays you to wait; lose the 50-day near $46.40 and the setup is broken.

Stay ahead of the market.
Get curated U.S. market news, insights and key dates delivered to your inbox.


AInvest
PRO
AInvest
PRO




Comments
No comments yet