
Venture Global Rebounds 3.96% From Key Fibonacci Support Amid Oversold Signals
Generated by AI AgentAinvest Technical Radar
Tuesday, Jul 8, 2025 7:03 pm ET2min read
VG--
Venture Global (VG) closed at $15.76, rising 3.96% in the latest session after testing a low of $14.89. This rebound occurred near critical Fibonacci support, aligning with oversold signals from momentum indicators. The technical landscape suggests cautious optimism, though volume divergence warrants monitoring.
Candlestick Theory
Recent sessions reveal significant candlestick patterns. The July 7th session formed a hammer near $14.52 (low), signaling potential reversal after a 2.57% decline. This was confirmed by July 8th’s bullish engulfing candle, closing near the high of $15.98 after dipping to $14.89. Key support is established at $14.50–$14.90, aligning with the June low of $14.48. Resistance converges at $16.00–$16.50, reflecting the June 24th swing high ($16.88) and the 23.6% Fibonacci retracement level of the primary uptrend.
Moving Average Theory
Shorter-term moving averages show ambiguity, while longer-term trends remain positive. The 50-day MA (currently ~$13.80) slopes upward, supporting the broader bullish trend from April’s $6.75 low. However, the price trades below the 100-day MA (~$15.30), creating near-term resistance. Recent closes beneath this level (July 1–8) suggest weakening momentum. A sustained break above $15.30 would signal strength, while failure risks testing the 50-day MA.
MACD & KDJ Indicators
MACD shows bearish momentum easing, with its histogram lifting from July 7th’s trough despite negative territory. This divergence hints at slowing downward pressure. KDJ is more decisive: The %K line (17.2) crossed above %D (12.5) on July 8th from oversold territory (<20), signaling a bullish reversal setup. Confluence between MACD histogram improvement and KDJ crossover strengthens the short-term recovery thesis.
Bollinger Bands
Bollinger Bands contracted sharply in late June, preceding the breakdown from $19.50 to $14.89 (-23.6%). July’s consolidation near the lower band ($15.20–$15.80) resolved upward, with price reclaiming the 20-period midline ($15.50). This band expansion on July 8th supports bullish momentum. Volatility remains elevated relative to June, suggesting continued directional intensity.
Volume-Price Relationship
Volume trends reveal divergence. The July 8th rally occurred on below-average volume (3.99M shares vs. 10-day avg: 4.87M), weakening conviction. Conversely, the June 23rd selloff to $16.54 saw climactic volume (11.98M), potentially marking capitulation. Bullish reversals require volume confirmation; sustained upside on rising volume would validate recovery.
Relative Strength Index (RSI)
RSI (14-period) rebounded from oversold extremes. It registered 28.6 on July 7th—the lowest since April—before climbing to 38.1 on July 8th. While still neutral, this recovery from <30 aligns with prior oversold bounces (e.g., April 10th at RSI 29.2 preceded a 21% rally). RSI divergence (price made a lower low July 7th vs. late June, but RSI held higher) reinforces reversal potential, though sustained gains above 50 are needed for trend confirmation.
Fibonacci Retracement
Primary Fibonacci retracement (swing low: $6.75 on April 7th; swing high: $19.50 on June 23rd) identifies $14.63 (38.2% retracement) as critical support. July’s dip to $14.89 respected this level, forming a double bottom with June’s $14.48 low. The rebound from this confluence zone suggests buyers are defending the uptrend’s structure. Upside targets include $16.49 (23.6%) and $17.50 (0%), while a break below $14.63 risks a slide to $13.13 (50%).
Confluence & Divergence Insights
Notable confluence exists: Fibonacci support ($14.63) aligned with Bollinger Band lows and oversold KDJ/RSI readings to catalyze the July 8th bounce. However, volume divergence and resistance at the 100-day MA ($15.30) temper bullish conviction. Bearish divergence is observed in MACD, which remains negative despite price recovery—a sign of underlying fragility. Resolution above $16.00 with expanding volume would confirm bullish momentum; failure risks retesting $14.50.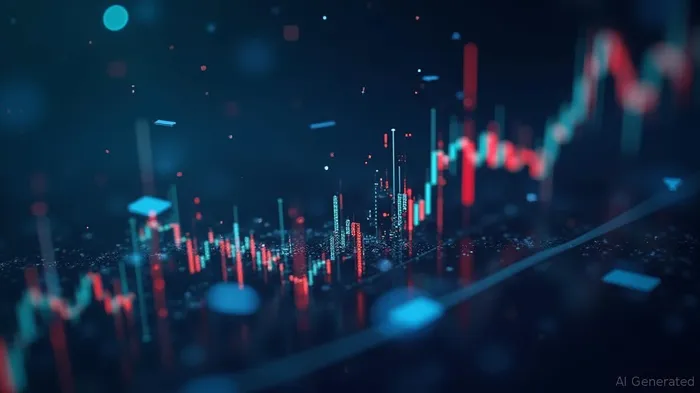
If I have seen further, it is by standing on the shoulders of giants.
Latest Articles
Stay ahead of the market.
Get curated U.S. market news, insights and key dates delivered to your inbox.
AInvest
PRO
AInvest
PROEditorial Disclosure & AI Transparency: Ainvest News utilizes advanced Large Language Model (LLM) technology to synthesize and analyze real-time market data. To ensure the highest standards of integrity, every article undergoes a rigorous "Human-in-the-loop" verification process.
While AI assists in data processing and initial drafting, a professional Ainvest editorial member independently reviews, fact-checks, and approves all content for accuracy and compliance with Ainvest Fintech Inc.’s editorial standards. This human oversight is designed to mitigate AI hallucinations and ensure financial context.
Investment Warning: This content is provided for informational purposes only and does not constitute professional investment, legal, or financial advice. Markets involve inherent risks. Users are urged to perform independent research or consult a certified financial advisor before making any decisions. Ainvest Fintech Inc. disclaims all liability for actions taken based on this information. Found an error?Report an Issue

ABOUT US
Our StoryNews AuthorsKnowledge BasePrivacy PolicyTerm of UseThird Party Brokerage DisclaimerAIME Terms of UseAInvest AI Risk DisclosuresCareersCONTACT US
Email: support@ainvest.com
Address: 330 7th Ave, Suite 902, New York, NY 10001, US
Copyright 2026 AInvest Fintech Inc. All rights reserved.
Comments
No comments yet