
Venture Global Gains 0.69% Amid Oversold Signals As 14.00 Support Holds
Generated by AI AgentAinvest Technical Radar
Monday, Jul 28, 2025 6:49 pm ET2min read
VG-- Aime Summary
Venture Global (VG) rose 0.69% in the most recent session, closing at 14.56 after testing a new reaction low of 14.11. This price action occurs within a broader technical context requiring multi-indicator assessment.
Candlestick Theory
Recent sessions show a pronounced downtrend characterized by lower highs and lower lows, with the July 25 session forming a potential hammer reversal pattern (intraday high 14.68, low 14.11, close 14.56). Key resistance is established at 15.00-15.20, stemming from the July 21-22 consolidation range. The 14.00 level emerges as critical psychological support, defended during the last two sessions. A confirmed close above 14.80 would disrupt the immediate bearish pattern.
Moving Average Theory
The 50-day moving average (15.82) crossed below the 100-day moving average (14.90) in early July, confirming intermediate-term bearish alignment. Current price (14.56) trades below both averages, reinforcing downtrend persistence. The 100-day moving average now acts as dynamic resistance, having capped rebound attempts throughout July. The death cross configuration suggests sustained downward pressure absent a decisive break above 15.20.
MACD & KDJ Indicators
MACD registers at -0.45 with the signal line at -0.38, reflecting bearish momentum but with a tightening histogram suggesting diminished downside acceleration. KDJ oscillators show %K at 18 and %D at 14, both deeply oversold. This divergence—where momentum indicators show oversold exhaustion while price makes new lows—historically precedes technical rebounds. Convergence in MACD lines may signal weakening bearish control.
Bollinger Bands
Bollinger Band width expanded 22% during July’s decline, indicating volatility surge typically preceding directional shifts. Price touched the lower band (13.85) on July 25 before recovering. The 20-day moving average (15.76) arcs downward, creating resistance confluence with the 100-day MA. A close above 15.00 would shift price toward the mid-band, alleviating immediate bearish pressure.
Volume-Price Relationship
Distribution patterns dominate, with July 23’s breakdown occurring on elevated volume (9.4M shares versus 3.6M average), validating downside conviction. Recent up days display muted volume (July 25 volume 3.59M shares, -9% below average), suggesting weak buying interest. Sustained recovery requires volume expansion exceeding 5M shares on upward moves to confirm accumulation.
Relative Strength Index (RSI)
The 14-day RSI reads 29.7, formally entering oversold territory for the first time since the April decline. However, RSI has maintained a sub-40 posture for eight sessions, indicating persistent weakness. While oversold conditions warn of exhaustion, they rarely constitute standalone reversal signals during strong trends. RSI divergence is absent, as new price lows correspond with new RSI lows.
Fibonacci Retracement
Using the swing high of 19.50 (June 23) and swing low of 7.31 (April 4), key Fibonacci levels materialize at 16.62 (23.6%), 14.84 (38.2%), 13.41 (50.0%), and 11.97 (61.8%). Current price fluctuates between the 38.2% and 50% retracement zones. The 14.84 level transitioned from support to resistance in mid-July, while 13.41 represents the next major downside target and potential stabilization zone.
Confluence appears between Bollinger Band support (13.85), Fibonacci 50% level (13.41), and psychological support at 14.00. Bearish consensus dominates through moving average alignment and volume distribution, though oversold KDJ and potential candlestick reversal suggest near-term stabilization prospects. The critical watchpoint remains the 14.00 support zone; failure here projects continuation to 13.41, while hold and reversal above 14.80 could trigger short-covering towards 15.50 resistance.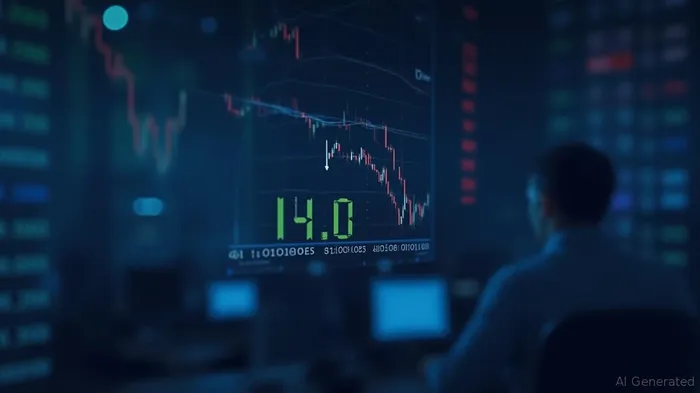
If I have seen further, it is by standing on the shoulders of giants.
Latest Articles
Stay ahead of the market.
Get curated U.S. market news, insights and key dates delivered to your inbox.
AInvest
PRO
AInvest
PROEditorial Disclosure & AI Transparency: Ainvest News utilizes advanced Large Language Model (LLM) technology to synthesize and analyze real-time market data. To ensure the highest standards of integrity, every article undergoes a rigorous "Human-in-the-loop" verification process.
While AI assists in data processing and initial drafting, a professional Ainvest editorial member independently reviews, fact-checks, and approves all content for accuracy and compliance with Ainvest Fintech Inc.’s editorial standards. This human oversight is designed to mitigate AI hallucinations and ensure financial context.
Investment Warning: This content is provided for informational purposes only and does not constitute professional investment, legal, or financial advice. Markets involve inherent risks. Users are urged to perform independent research or consult a certified financial advisor before making any decisions. Ainvest Fintech Inc. disclaims all liability for actions taken based on this information. Found an error?Report an Issue

ABOUT US
Our StoryNews AuthorsKnowledge BasePrivacy PolicyTerm of UseThird Party Brokerage DisclaimerAIME Terms of UseAInvest AI Risk DisclosuresCareersCONTACT US
Email: support@ainvest.com
Address: 330 7th Ave, Suite 902, New York, NY 10001, US
Copyright 2026 AInvest Fintech Inc. All rights reserved.
Comments
No comments yet