
Valero Energy Jumps 3.85% To $154.81 On Strong Technical Momentum
Generated by AI AgentAinvest Technical Radar
Thursday, Jul 10, 2025 6:43 pm ET2min read
VLO--
Valero Energy (VLO) recently demonstrated significant upward momentum, gaining 3.85% to close at $154.81 and extending its winning streak to three consecutive sessions, resulting in a 7.70% cumulative advance. This analysis examines the technical landscape using multiple frameworks.
Candlestick Theory
The recent candlestick formation displays a robust bullish pattern. July 8th’s long green candle (low: $143.78, high: $148.97) signaled strong buying interest after brief consolidation. This was followed by a near-doji candle on July 9th (low: $147.86, high: $150.36), indicating indecision. The breakout on July 10th (low: $147.82, high: $155.115) confirmed bullish continuation on elevated volume, establishing $155.11 as immediate resistance. Key support resides near $147.82 (July 10th low), backed by the $143.78 swing low from July 8th. The $150 psychological level may now act as secondary support.
Moving Average Theory
Valero maintains a bullish moving average configuration, with the price above all key averages. The 50-day MA (approximately $142) supports the current uptrend, while the 100-day MA (around $135) and 200-day MA (near $130) demonstrate a healthy long-term trajectory. The sequence—price > 50-day > 100-day > 200-day—confirms a strong intermediate uptrend. This alignment suggests persistent buying pressure, though a close below the 50-day MA would be needed to signal potential trend weakness.
MACD & KDJ Indicators
The MACD shows sustained bullish momentum, with the MACD line above its signal line and a widening positive histogram. This aligns with recent price strength. Conversely, the KDJ oscillator presents an overbought signal, with %K near 98.6 (using a 9-day period). While this divergence may indicate short-term exhaustion, it lacks confirmation from MACD. The momentum discrepancy suggests possible consolidation, though the primary trend remains intact.
Bollinger Bands
Price action is testing the upper Bollinger Band near $155.11, coinciding with the July 10th high. Band expansion over the last three sessions reflects increasing volatility, typically supportive of directional trends. A sustained position near the upper band confirms bullish strength, but a rejection here may trigger short-term profit-taking. The middle band (20-day MA, approximately $145) offers immediate support.
Volume-Price Relationship
Volume dynamics validate the bullish price action. The July 8th surge (+3.43%) occurred on 7.59M shares—the highest volume in three weeks—confirming institutional participation. Follow-through gains on July 10th (+3.85%) saw volume rise 14% from the previous session to 3.76M shares, demonstrating sustained interest. This volume profile reinforces conviction behind the breakout.
Relative Strength Index (RSI)
The 14-day RSI (approximately 72) resides in overbought territory (>70), suggesting heightened near-term reversion risk. While this aligns with KDJ’s overbought reading, the RSI’s position is consistent with strong trends and doesn’t yet show bearish divergence. Historical instances of RSI >70 during this uptrend have resolved through sideways consolidation rather than sharp declines, indicating underlying strength.
Fibonacci Retracement
Applying Fibonacci levels to the recent swing low of $133.27 (June 27) and high of $155.11 (July 10) identifies key retracement supports. The 23.6% level at $149.96 aligns with the July 9th close and psychological $150 support. The 38.2% retracement at $146.77 converges with the July 7th swing low. These Fibonacci levels are reinforced by volume accumulation areas, increasing their technical relevance. Upside extension targets include the 161.8% level near $165.00.
Confluence and Divergence Notes
Confluence exists at the $149.96–$150 zone, where Fibonacci, psychological support, and the 20-day MA intersect. The bullish moving average hierarchy and volume-backed breakout present a unified intermediate-term upside bias. The primary divergence stems from overbought oscillators (KDJ and RSI) against sustained MACD momentum, which often precedes consolidation rather than reversal. The elevated Bollinger Band width suggests continued volatility, favoring tactical pullback entries near $149.96 support.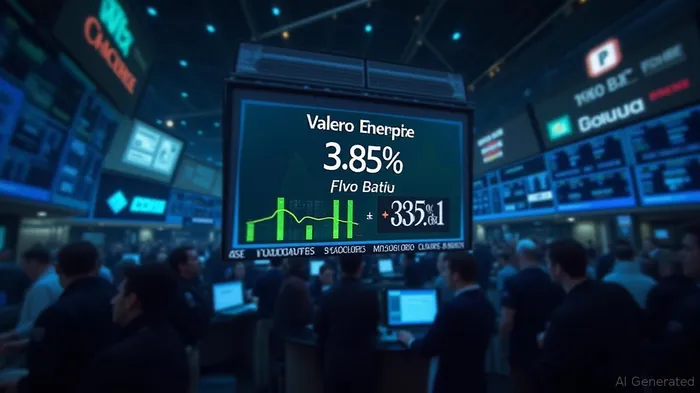
If I have seen further, it is by standing on the shoulders of giants.
Latest Articles
Stay ahead of the market.
Get curated U.S. market news, insights and key dates delivered to your inbox.
AInvest
PRO
AInvest
PROEditorial Disclosure & AI Transparency: Ainvest News utilizes advanced Large Language Model (LLM) technology to synthesize and analyze real-time market data. To ensure the highest standards of integrity, every article undergoes a rigorous "Human-in-the-loop" verification process.
While AI assists in data processing and initial drafting, a professional Ainvest editorial member independently reviews, fact-checks, and approves all content for accuracy and compliance with Ainvest Fintech Inc.’s editorial standards. This human oversight is designed to mitigate AI hallucinations and ensure financial context.
Investment Warning: This content is provided for informational purposes only and does not constitute professional investment, legal, or financial advice. Markets involve inherent risks. Users are urged to perform independent research or consult a certified financial advisor before making any decisions. Ainvest Fintech Inc. disclaims all liability for actions taken based on this information. Found an error?Report an Issue

ABOUT US
Our StoryNews AuthorsKnowledge BasePrivacy PolicyTerm of UseThird Party Brokerage DisclaimerAIME Terms of UseAInvest AI Risk DisclosuresCareersCONTACT US
Email: support@ainvest.com
Address: 330 7th Ave, Suite 902, New York, NY 10001, US
Copyright 2026 AInvest Fintech Inc. All rights reserved.
Comments
No comments yet