
USTCUSDT Market Overview: Volatile 24-Hour Range with Mixed Momentum Signals
Summary
• Price surged to 0.0077 before retracting to 0.0073, forming a bearish reversal pattern.
• High volume during the peak suggests increased buying interest, but subsequent selling pressure emerged.
• RSI overbought levels and a divergence with price hint at potential near-term profit-taking.
• Volatility expanded with widening Bollinger Bands, indicating uncertainty in trend direction.
TerraClassicUSD/Tether (USTCUSDT) opened at 0.00709 on January 16 at 12:00 ET, rose to a high of 0.00782, and closed at 0.00726 on January 17 at 12:00 ET. Total 24-hour volume reached 80,431,587.0, with a turnover of approximately 603,229.58 USD.
Structure & Formations
Price surged sharply into a local high of 0.00782 before encountering selling pressure, forming a potential bearish reversal. 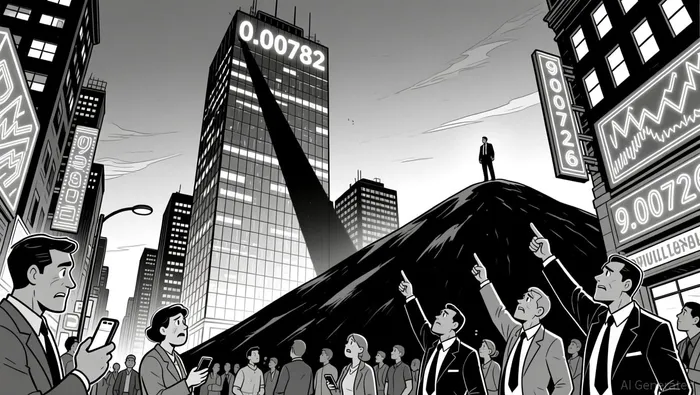 The pullback to 0.00726 created a large bearish candle near 0.0073, suggesting short-term exhaustion. Support at 0.00723–0.00725 is holding, with resistance likely near 0.00735–0.00738.
Moving Averages
On the 5-minute chart, price broke above the 20-period and 50-period moving averages during the rally but has since fallen below both, indicating weakening momentum. Daily MAs are not visible in the dataset, but recent intraday volatility suggests a retesting of key averages is likely.
MACD & RSI
MACD showed a bullish divergence during the 0.0073–0.0074 rally, but the histogram has turned bearish as price pulled back. RSI peaked above 70 in the 0.0075–0.0076 range and now rests near 50–55, signaling neutral to slightly bearish momentum.
Bollinger Bands
Volatility expanded significantly during the peak, with Bollinger Bands widening to accommodate the 0.0073–0.00782 range. Price is currently trading near the lower band, suggesting a potential rebound or a continuation of bearish pressure.
Volume & Turnover
The most dramatic move occurred between 19:30–20:30 ET, with over 60 million volume and a turnover of nearly 457,000 USD. This suggests strong participation in both the rally and subsequent sell-off. The volume has since declined, indicating possible exhaustion.
Fibonacci Retracements
On the 5-minute chart, the pullback from 0.00782 to 0.00736 aligns with the 50% Fibonacci level, while the current level near 0.00726 is approaching the 61.8% retracement. A break below 0.00722 would test the next key level at 0.00715.
USTCUSDT may consolidate or retest 0.00735–0.00738 in the next 24 hours, depending on whether buyers re-enter at lower levels. Investors should monitor for a breakdown below 0.00722, which could accelerate the decline.
Decoding market patterns and unlocking profitable trading strategies in the crypto space
Latest Articles
Stay ahead of the market.
Get curated U.S. market news, insights and key dates delivered to your inbox.


Comments
No comments yet