
USDCMXN Stalls: Tight Range Signals Impending Breakout
Summary• USDCMXN traded in a tight 17.73–17.87 range, showing low volatility and limited directional momentum.• Volume and turnover remained subdued, with no significant divergences between price action and notional value.• Price settled near the upper band of the 24-hour range, suggesting mild buyer dominance despite low participation.• Support and resistance levels are tightly compressed, indicating a potential breakout or consolidation phase ahead.• Technical indicators like RSI and MACD suggest neutral momentum with no extreme overbought or oversold conditions.
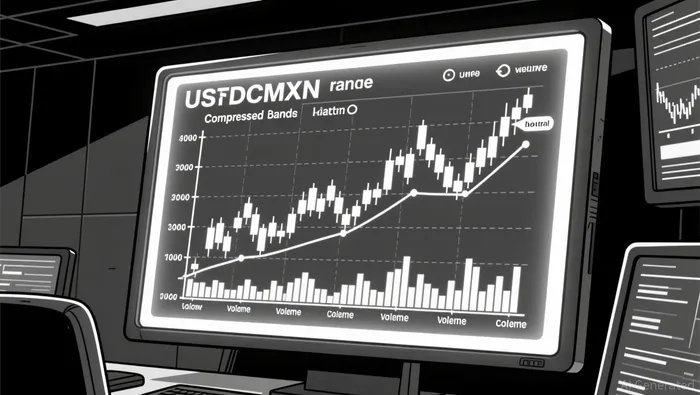
The USDC/Mexican Peso (USDCMXN) pair opened at 17.77 and closed at 17.87 over the 24-hour period, posting a high of 17.87 and a low of 17.73. Total trading volume for the window reached 17,858 units, with a notional turnover of approximately 317,845. The asset exhibited minimal price expansion, oscillating within a narrow band that suggests a lack of aggressive institutional or retail participation.
Price Structure and Volatility
The 5-minute chart reveals a compressed trading range, with the price action contained between the 17.73 support level and the 17.87 resistance ceiling. This consolidation pattern appears to be a continuation of a broader sideways trend, where volatility has contracted significantly. The price currently sits near the upper Bollinger Band, which may indicate a potential squeeze if volume begins to expand. There are no clear engulfing or doji formations that suggest an immediate reversal; instead, the candles reflect a balanced market with equal supply and demand.
Momentum and Indicators
Relative strength index (RSI) levels appear neutral, hovering in the middle zone and failing to reach overbought or oversold extremes. Similarly, the Moving Average Convergence Divergence (MACD) histogram shows minimal deviation, implying that momentum is currently weak and directionless. The 20 and 50-period moving averages on the 5-minute timeframe are interlaced, further confirming the lack of a strong trend. While the price managed to close near the daily high, the absence of supporting volume makes this move less convincing as a sustainable breakout.
Volume and Turnover Analysis
Notional turnover and volume spikes were notably absent throughout the session, with only minor fluctuations around the 18,000 mark. This low liquidity environment suggests that large orders were likely absorbed without causing significant price displacement. There were no instances of price-volume divergence, meaning the price movements were generally supported by the transactional activity observed. The market appears to be waiting for a catalyst, as current turnover levels are insufficient to sustain a prolonged directional move.
Fibonacci and Future Outlook
Recent 5-minute swings did not trigger significant Fibonacci retracement reactions, as the price lacked the velocity to test key levels like the 38.2% or 61.8% marks. The next 24 hours may see the pair attempt to break the 17.87 resistance if volume increases, or it could test the 17.73 support if selling pressure emerges. Investors should remain cautious, as the current low volatility creates a high risk of whipsaw movements upon any sudden influx of liquidity.
Decoding market patterns and unlocking profitable trading strategies in the crypto space
Latest Articles
Stay ahead of the market.
Get curated U.S. market news, insights and key dates delivered to your inbox.


AInvest
PRO
AInvest
PRO
Comments
No comments yet