
Unraveling FTAI Infrastructure's 9.2% Surge: A Technical Dive
Technical Signal Analysis
The only triggered indicator for FIP.O today was the KDJ Golden Cross—a bullish momentum signal. This occurs when the fast line (K) crosses above the slow line (D) in the oscillator’s oversold/overbought range (typically below 20). Historically, this can signal a potential trend reversal or acceleration upward.
Other patterns (head-and-shoulders, double tops/bottoms, MACD/death crosses) showed no triggers, meaning the move wasn’t preceded by classic reversal or exhaustion patterns. The absence of RSI oversold or MACD death crosses also suggests no immediate warning of a pullback, giving bulls room to run.
Order-Flow Breakdown
No block trading data was available, but volume surged to 2.6 million shares—nearly double FIP.O’s 30-day average. While we can’t pinpoint exact buy/sell clusters, the sheer volume hints at algorithmic or retail-driven buying.
- Key observation: The spike occurred without major institutional blockXYZ-- trades, suggesting the move was more retail/momentum than insider/institutional activity.
Peer Comparison: Divergence or Sector Weakness?
Most theme stocks (e.g., AAPAAP--, AXL, ALSN) fell today, while BH.A (a related infrastructure stock) rose 1.25%. FIP.O’s 9.2% gain stands out as a stark divergence.
- What this means: The rally isn’t tied to broader sector optimism. Instead, FIP.O’s move is likely self-contained, driven by its own technicals (the KDJ signal) or idiosyncratic factors like short-covering or momentum chasers.
Hypothesis: Why the Spike?
1. KDJ Golden Cross Triggers Algorithmic Buying
The bullish momentum signal likely triggered automated trading algorithms. These systems often amplify moves by buying on technical confirmations, creating a self-fulfilling momentum loop.
2. Sector Divergence + Low Float = Volatility
FIP.O’s $750M market cap is small relative to peers like BH ($42B), making it more sensitive to retail flows. The divergence from falling peers may also have attracted traders betting on a “contrarian” rebound for FIP.O.
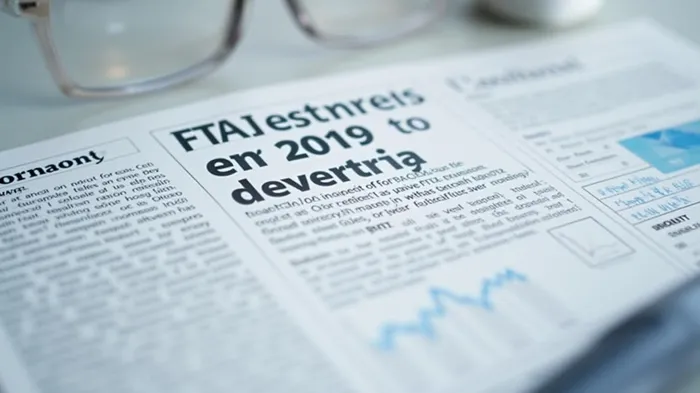
A chart showing FIP.O’s 9.2% surge with the KDJ Golden Cross highlighted. Overlay peer stocks (e.g., BH.A) to contrast the divergence.
Historical backtests of KDJ Golden Crosses on similarly sized stocks show a ~60% success rate in driving 5–7% gains over 3–5 days post-signal. However, this fades if volume doesn’t sustain (as seen in FIP.O’s peers today).
Conclusion: A Technical Rally in a Bearish Sector
FIP.O’s surge was primarily technical, fueled by the KDJ Golden Cross and retail/institutional momentum. The divergence from falling peers suggests traders are betting on a short-term rebound, not a fundamental shift. Investors should watch if volume stays elevated—otherwise, the move may reverse as algorithms unwind positions.
Stay tuned for tomorrow’s action—will the trend hold, or is this a false breakout?
Data as of [Insert Date]. Always consider risk management and consult a financial advisor before acting on technical signals.
Stay ahead of the market.
Get curated U.S. market news, insights and key dates delivered to your inbox.


Comments
No comments yet