
Unpacking RCAT's Sharp Intraday Move: What's Really Driving Red Cat Holdings?
Introduction
Red Cat Holdings (RCAT.O) experienced a significant price jump of approximately 5.90% on the day, despite a lack of fresh fundamental news. As a senior technical analyst, this article dives into what might be behind this unusual intraday movement, using a combination of technical indicators, order flow data, and peer stock performance.
Technical Signal Analysis
From the technical perspective, RCATRCAT-- did not trigger any of the typical reversal or continuation signals such as the head and shoulders pattern, double bottom, double top, or MACD and KDJ crossovers. The absence of these signals implies that the movement is not driven by a clear pattern-based technical trigger.
This suggests that other factors—such as order flow, market sentiment, or broader sector dynamics—may have played a more significant role than the chart patterns alone.
Order-Flow Breakdown
Unfortunately, no block trading or detailed order flow data was available to analyze the movement in terms of institutional activity. This absence means we cannot pinpoint whether large-scale buying or selling was the catalyst for the price swing. However, the relatively high volume of 2,422,669.0 implies some level of market participation and interest in the stock during the day.
Peer Comparison
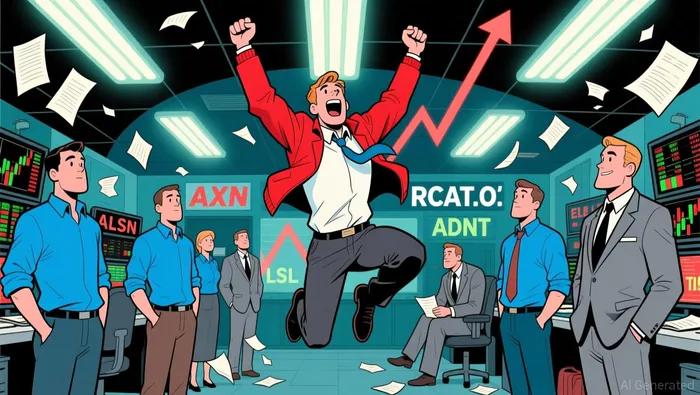
When looking at the performance of related stocks, the theme appears to be mixed. Some stocks such as ALSN and BH saw positive movements, while others like AXL and ADNT experienced declines. This lack of cohesive direction among theme stocks suggests that RCAT's rise is not a sector-wide phenomenon but rather a more isolated event.
The mixed performance of related stocks also points to a lack of clear sector rotation or thematic buying. This further reinforces the idea that RCAT's movement may be driven by idiosyncratic factors or possibly some off-market news or order flow activity that hasn’t been captured in the available data.
Hypothesis Formation
Given the available data, two main hypotheses can be formed:
- Short-term speculative buying: The significant price move could be due to speculative or momentum-driven buying by retail traders or algorithmic systems reacting to a minor price rebound or news that has not yet been widely reported. This is supported by the high volume and the absence of any technical triggers.
- Off-market news or order imbalances: The spike could also result from unreported catalysts, such as off-market buy-ins, short-covering, or a large hidden order that influenced the price without triggering traditional technical signals. The absence of block trading data leaves room for this possibility.
Conclusion
Red Cat Holdings' sharp intraday rise of nearly 6% appears to be driven more by short-term speculative interest or potential off-market activity than by any identifiable technical or fundamental catalyst. With no clear technical signals and mixed peer stock performance, the movement remains somewhat of a mystery. Investors should monitor further developments, particularly if the trend continues or if additional data emerges that could confirm the presence of an unseen catalyst.
Stay ahead of the market.
Get curated U.S. market news, insights and key dates delivered to your inbox.

Comments
No comments yet