
UMC Turned the AI-Capex Rout Into an $18 Floor — $19.50 Now Decides the Next Leg
 Aime Summary
UMC Turned the AI-Capex Rout Into an $18 Floor — $19.50 Now Decides the Next Leg
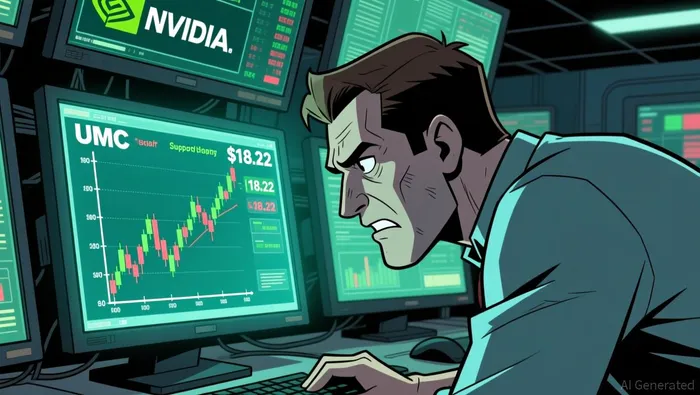
The ADR closed up 3.9% Monday and defended the $18.22 low set during Aug. 18's sector-wide AI-spending scare — on a day when the rest of the chip tape slipped ahead of Nvidia's report. Reclaim $19.50 and the 50-day becomes the target; lose $18.22 and the next floor sits near the mid-teens. The clock is two sessions long.

Data as of the Aug. 24 session, about 8:47 p.m. ET, from live market snapshots.
United Microelectronics closed Monday at $19.05, up 3.9%, after a session that gapped 6% higher at the open, slid from $19.50 to $18.77, and clawed back to $19 by the close. Individually, the bar is unremarkable. Placed against the session it happened in, it is the first chip chart all week that refused to roll over: the broader tape slipped — chip stocks "slipped ahead of NVDA's earnings" — while this ADR defended the very level that broke the foundry complex a week earlier.
The floor that did not break
The floor is new and it is specific. On Aug. 18, UMC fell 7% as a Wall Street Journal report that nine top tech companies hold roughly $3 trillion in off-balance-sheet AI commitments set off a sector-wide de-rating: Tower Semiconductor down 10%, GlobalFoundries down 7%, TSMC down 4%, the semiconductor ETF off 6% while the Nasdaq 100 fell under 2%. A 30-year Treasury near a 19-year high added to the overhang. It was a macro de-rate, not a UMCUMC-- number — and the stock tagged $18.22 that afternoon and has never closed below it since. Monday's $18.77 low was the third defense of the shelf, a higher low on a weak sector tape.
The level has more behind it than one bad Tuesday. $18.22 sits just above the 50% retracement of the full 52-week advance from $6.56 to the $28.96 high — the spring AI re-rating that turned a cheap foundry into a momentum name. Capitulation lows at major retracements have memory because the two groups that build a floor meet there: the traders selling the fear, and the investors buying the now-cheaper thesis. And the thesis never broke. UMC's second quarter, reported July 29, beat estimates by a wide margin — the ADR earned $0.54 a share against roughly $0.16 consensus — with revenue up 12.6% sequentially to NT$68.73 billion, utilization at 85%, and its 22nm line grown to 17.5% of revenue. The corporate story improved while the chart lost about a third of its value. That mismatch is why the floor is interesting, and it is also why a break below it would be dangerous rather than routine.
Who is not short
The part of the positioning story most commentary skips is who is missing from it. UMC's short interest was about 0.89% of the float as of mid-July, down sharply from the prior report, with roughly 1.2 days to cover. There is no squeeze powder in this name. That cuts both ways: a rally through resistance has to be bought, not covered, and Monday's inflow supports rather than proves the case — buyers edged out sellers in every size class, but the margin was thin. Relief, not a stampede. The demand is strong enough to defend a level, not yet strong enough to confirm a reversal by itself.
Everything runs through two prices
A daily close above $19.50 — Monday's gap high and the point where the fade began — confirms the floor and opens the path to $20.40 (the 38.2% retracement) and the 50-day average at $21.78, the level the breakdown started beneath. From the trigger that is roughly a 12% leg against an invalidation far below. A close under $18.22 pulls the floor out: the next structural shelf is the 50% retracement near $17.75, then a thin stretch into the $15–16 zone before the 200-day average far beneath. A break there does not just end the bounce; it puts the entire post-spring AI premium on trial.
| Scenario | Trigger | Path | Invalidation | Horizon |
|---|---|---|---|---|
| Floor holds — rebuild | Daily close above $19.50 | $20.40, then 50-day $21.78 | Close below $18.22 | Multi-session to multi-week |
| Floor fails — breakdown | Close below $18.22 | $17.75, then $15–16 zone | — | Accelerates into the NVDA reaction |
The clock
The urgency is the point. Nvidia reports Wednesday, two sessions from Monday's close, and UMC's chart is effectively a one-line bet on that print. If NvidiaNVDA-- soothes the off-balance-sheet capex worry, the group's first mechanical move is to reclaim the gap high and buy back the breakdown zone. If it feeds the fear, $18.22 gets its fourth and most dangerous test within days.
The setup has not decayed — Monday's close sits only about 2.4% below the trigger, not far past a gone level. But it is time-sensitive. The map says to let the sweep of $19.50 with expanding volume confirm the floor rather than paying $19.05 for a bounce that has not cleared its first obstacle. Hold $18.20 and the rebuild toward the 50-day stays in play; lose it and the next leg down opens. One of those closes arrives this week.

Stay ahead of the market.
Get curated U.S. market news, insights and key dates delivered to your inbox.


AInvest
PRO
AInvest
PRO




Comments
No comments yet