
UAIUSDT Spike Fizzles: Whales Hit 0.4763 Wall
 Aime Summary
Summary
- UAIUSDT experienced extreme volatility with a sharp intraday surge followed by a significant rejection and pullback.
- Volume spiked massively at 10:00 UTC, indicating strong institutional or whale activity driving the initial move.
- Price action suggests a potential mean reversion phase after a substantial 7-day uptrend of over 44 percent.
- Key resistance near 0.4763 held firm, leading to a swift rejection and downward pressure on buyers.
- Current structure appears range-bound with high uncertainty, requiring close monitoring of the 0.417 support zone.
Severe Intraday Rejection
UnifAI Network/Tether (UAIUSDT) closed the 24-hour period with a latest 1-hour OHLC price of 0.4717, reflecting significant intraday turbulence. The asset recorded a 24-hour total volume that exceeded typical averages, driven by a massive spike at 10:00 UTC, resulting in high turnover as buyers tested upper limits before facing heavy selling pressure.
1-Hour Support/Resistance and Candlestick Patterns
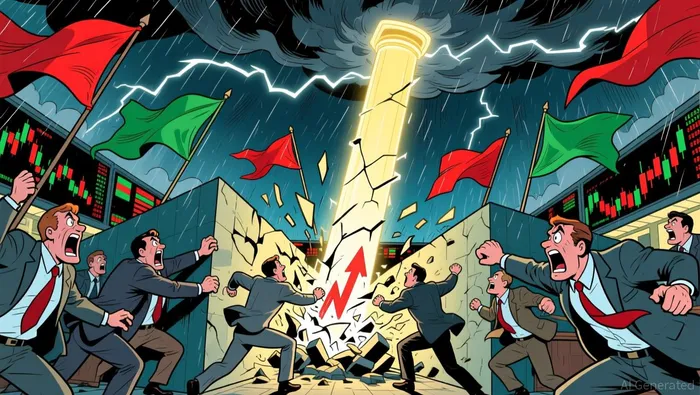
Price action in the recent 1-hour chart reveals a clear battle between buyers and sellers around the 0.4763 high, which acted as a strong resistance level. The candle at 10:00 UTC showed a long upper shadow, indicating that prices reached 0.4763 but were rejected sharply to close at 0.4263. This rejection was followed by a bullish engulfing pattern at 12:00 UTC, where the body fully covered the prior candle's range, suggesting a temporary recovery attempt. However, the subsequent price action remains closer to the immediate support level of 0.417, which was tested during the pullback. The presence of a long lower shadow at 11:00 UTC further confirms that buyers are attempting to defend this lower range, but the overall structure suggests that resistance near 0.4763 remains a critical barrier that needs to be cleared for sustained upward momentum.
Volume and Turnover vs. Historical Comparison
The 24-hour total volume was significantly higher than the 7-day average daily volume of approximately 4 million and the 15-day average of 2.45 million, driven primarily by anomalous spikes. Specifically, the hour at 10:00 UTC recorded a volume of 1,326,822, which is roughly eight times the average single-hour volume of 169,147 over the past week. This massive volume spike coincided with a price increase, but the subsequent hours showed high volume with no follow-through, as prices dropped from 0.47105 to 0.42635 despite the intense activity. The hour at 11:00 UTC also saw elevated volume of 787,429, yet prices continued to struggle, indicating that the buying pressure was absorbed by sellers. These volume anomalies appear to have driven the initial price surge but failed to sustain it, suggesting that the high volume was largely driven by profit-taking or liquidation rather than new bullish conviction.
Look Back: Current Market Phase
The market structure over the past 7 to 15 days indicates a strong uptrend that has recently entered a mean reversion phase. Over the past 7 days, the price increased by approximately 44 percent, and over 3 days, it rose by about 32 percent, which are substantial moves exceeding the 15 percent threshold for mean reversion classification. The current 15-day daily price range of 0.2 suggests that the asset is consolidating after this rapid ascent. The sharp intraday reversal observed on August 1st, following a period of steady gains, supports the interpretation that the market is currently in a mean reversion phase. This phase suggests that the previous strong uptrend is pausing or reversing, and prices may seek to retest lower support levels before any potential continuation.
Looking ahead to the next 24 hours, the price may continue to consolidate or retest lower support levels as the market digests the recent volatility. An upside break above 0.4763 could signal a resumption of the uptrend, while a downside break below 0.417 may indicate further correction toward deeper support zones.

Decoding market patterns and unlocking profitable trading strategies in the crypto space
Latest Articles
Stay ahead of the market.
Get curated U.S. market news, insights and key dates delivered to your inbox.


AInvest
PRO
AInvest
PRO




Comments
No comments yet