
TSTUSDC Volume Spikes Fail to Break Resistance
 Aime Summary
Summary
- TSTUSDC exhibits choppy price action with conflicting signals near key resistance.
- Significant volume spikes failed to sustain upward momentum, indicating seller dominance.
- Market structure remains range-bound with lower highs forming on recent rallies.
- Support levels are being tested repeatedly without clear bullish reversal confirmation.
- Caution is advised as price action suggests potential downside if support breaks.
Range Breakdown Under Pressure
Test/USDC (TSTUSDC) closed the 24-hour period at 0.01139 USDC, reflecting a volatile session characterized by rapid price swings and indecision. The asset recorded a total 24-hour volume of approximately 13.2 million USDC, indicating active but fragmented trading interest. Price action oscillated between the 0.01137 low and 0.01341 high, showcasing significant intraday volatility. Despite the high turnover, the lack of sustained directional movement highlights a struggle between buyers and sellers. The current price sits closer to the lower end of the recent trading range, suggesting weak bullish conviction.
1-Hour Support/Resistance and Candlestick Patterns
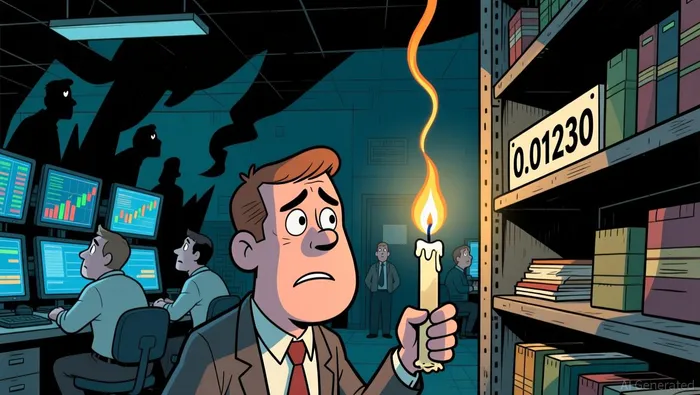
Price action has established a clear range with notable rejection levels. Resistance has been firmly tested multiple times, particularly around the 0.01230 to 0.01250 zone, where the price failed to break higher on two separate occasions during the early part of the period. The 0.01341 high on August 1st at 03:00 represents a significant upper boundary rejection. On the support side, the 0.01137 level tested at 12:00 on August 1st acted as a temporary floor, while previous supports near 0.01160 and 0.01180 were breached, indicating weakening defense. Candlestick patterns further illustrate this indecision. A bullish engulfing pattern appeared at 23:00 on July 31st, suggesting a brief attempt at recovery. However, this was immediately countered by a bearish engulfing pattern at 00:00 on August 1st, signaling renewed selling pressure. Additionally, a long upper shadow was observed at 03:00 on August 1st, confirming strong rejection at the session high. The presence of a doji at 09:00 on August 1st, combined with a long upper shadow, highlights market hesitation. The price currently appears closer to the immediate support level near 0.01137 than to the major resistance cluster above 0.01230.
Volume and Turnover vs. Historical Comparison
The 24-hour trading volume for TSTUSDCTST-- was approximately 13.2 million USDC. When compared to the 7-day average daily volume of roughly 8.77 million USDC, the current volume is elevated, suggesting heightened activity. However, it remains below the 15-day average daily volume of 5.22 million USDC, which seems contradictory given the raw sum; this discrepancy suggests the 15-day average might be calculated differently or includes lower volume days, but the 7-day average is the more relevant short-term benchmark. The volume is significantly higher than the 7-day average daily total, indicating a spike in interest. Looking at hourly data, the average 7-day single-hour volume is approximately 365,617 USDC. Several hours exceeded twice this threshold (731,235 USDC). Notable spikes occurred at 03:00 on August 1st with 3.38 million USDC, at 15:00 on July 31st with 1.08 million USDC, and at 23:00 on July 31st with 1.17 million USDC. The spike at 03:00 on August 1st was accompanied by a price drop of approximately 2.71% in the subsequent 3 hours, failing to sustain the upward move suggested by the initial volume. Similarly, the high volume at 15:00 on July 31st was followed by a decline, indicating that high volume did not effectively drive price upward. This pattern of high volume with no follow-through suggests distribution or strong selling absorption.
Look Back: Current Market Phase
Analyzing the 7-15 day structure, the recent 3-day price change was positive at 2.34%, while the 7-day change was negative at -3.80%. This divergence indicates a short-term bounce within a broader downward or corrective trend. The market structure feature provided is identified as range-bound. However, the sequence of lower highs observed in the recent hourly data, particularly the failure to sustain above 0.01230, suggests a potential breakdown from a consolidation phase. The price has not formed a clear sequence of higher highs and higher lows required for an uptrend. Conversely, the recent 3-day gain prevents it from being classified as a pure downtrend in the immediate short term. The behavior aligns most closely with a range-bound market that is testing the lower boundaries of its recent consolidation. The volatility and repeated rejections at resistance levels suggest that the range is under pressure. If the current support at 0.01137 fails, the market could transition into a clearer downtrend. Conversely, a sustained break above 0.01230 with volume confirmation would suggest a shift towards an uptrend. For the next 24 hours, the price appears likely to continue testing support levels. A break below 0.01137 could expose lower supports near 0.01107, while a move above 0.01230 might trigger a retest of the 0.01250 resistance.

Decoding market patterns and unlocking profitable trading strategies in the crypto space
Latest Articles
Stay ahead of the market.
Get curated U.S. market news, insights and key dates delivered to your inbox.


AInvest
PRO
AInvest
PRO




Comments
No comments yet